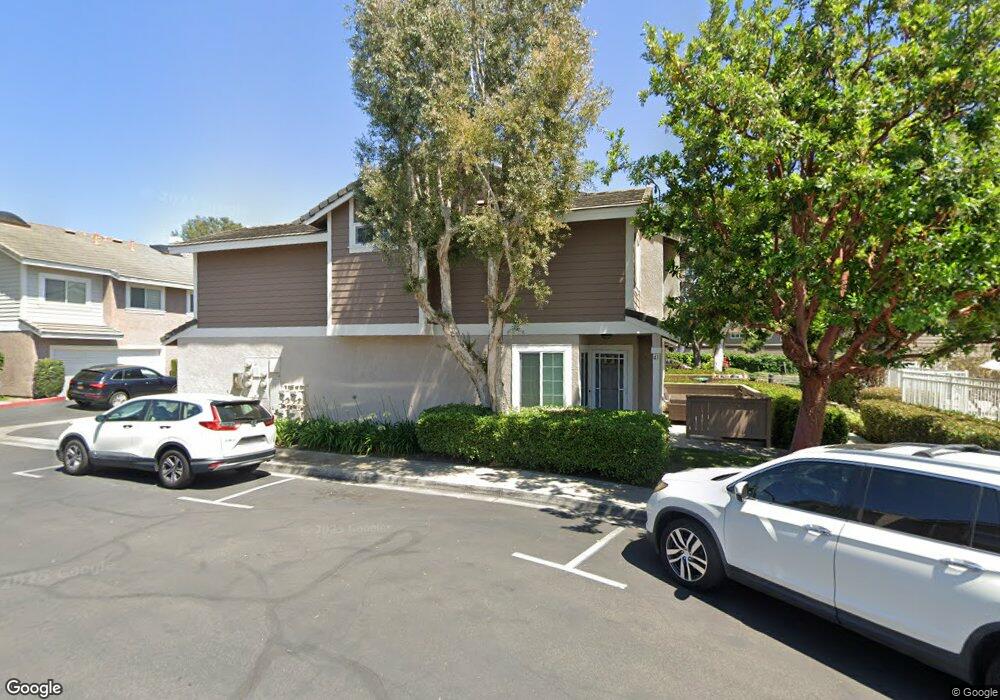
39 Christamon S Unit 3 Irvine, CA 92620
Northwood NeighborhoodEstimated Value: $827,757 - $1,017,000
2
Beds
3
Baths
1,153
Sq Ft
$786/Sq Ft
Est. Value
About This Home
This home is located at 39 Christamon S Unit 3, Irvine, CA 92620 and is currently estimated at $906,439, approximately $786 per square foot. 39 Christamon S Unit 3 is a home located in Orange County with nearby schools including Santiago Hills Elementary School, Sierra Vista Middle School, and Northwood High School.
Ownership History
Date
Name
Owned For
Owner Type
Purchase Details
Closed on
Jul 7, 2009
Sold by
Hommes Alexander Magnus
Bought by
Hommes Michelle
Current Estimated Value
Home Financials for this Owner
Home Financials are based on the most recent Mortgage that was taken out on this home.
Original Mortgage
$353,479
Interest Rate
5.37%
Mortgage Type
FHA
Purchase Details
Closed on
Jun 24, 2009
Sold by
Perez Jorge A and Hommes Michelle
Bought by
Arora Smriti and Arora Prabhat
Home Financials for this Owner
Home Financials are based on the most recent Mortgage that was taken out on this home.
Original Mortgage
$353,479
Interest Rate
5.37%
Mortgage Type
FHA
Purchase Details
Closed on
May 6, 1993
Sold by
Murphy Phillip P and Murphy Irene A
Bought by
Perez Jorge A and Perez Michelle R
Home Financials for this Owner
Home Financials are based on the most recent Mortgage that was taken out on this home.
Original Mortgage
$159,300
Interest Rate
7.2%
Create a Home Valuation Report for This Property
The Home Valuation Report is an in-depth analysis detailing your home's value as well as a comparison with similar homes in the area
Home Values in the Area
Average Home Value in this Area
Purchase History
| Date | Buyer | Sale Price | Title Company |
|---|---|---|---|
| Hommes Michelle | -- | Equity Title Orange County-I | |
| Arora Smriti | $360,000 | Equity Title Orange County-I | |
| Perez Jorge A | $177,000 | Commonwealth Land Title |
Source: Public Records
Mortgage History
| Date | Status | Borrower | Loan Amount |
|---|---|---|---|
| Previous Owner | Arora Smriti | $353,479 | |
| Previous Owner | Perez Jorge A | $159,300 |
Source: Public Records
Tax History Compared to Growth
Tax History
| Year | Tax Paid | Tax Assessment Tax Assessment Total Assessment is a certain percentage of the fair market value that is determined by local assessors to be the total taxable value of land and additions on the property. | Land | Improvement |
|---|---|---|---|---|
| 2025 | $4,901 | $464,688 | $355,883 | $108,805 |
| 2024 | $4,901 | $455,577 | $348,905 | $106,672 |
| 2023 | $4,775 | $446,645 | $342,064 | $104,581 |
| 2022 | $4,681 | $437,888 | $335,357 | $102,531 |
| 2021 | $4,573 | $429,302 | $328,781 | $100,521 |
| 2020 | $4,547 | $424,901 | $325,410 | $99,491 |
| 2019 | $4,447 | $416,570 | $319,029 | $97,541 |
| 2018 | $4,368 | $408,402 | $312,773 | $95,629 |
| 2017 | $4,278 | $400,395 | $306,641 | $93,754 |
| 2016 | $4,090 | $392,545 | $300,629 | $91,916 |
| 2015 | $3,977 | $386,649 | $296,113 | $90,536 |
| 2014 | $3,900 | $379,076 | $290,313 | $88,763 |
Source: Public Records
Map
Nearby Homes
- 45 Christamon S Unit 19
- 47 Christamon S Unit 18
- 47 Christamon S
- 41 Christamon S Unit 4
- 41 Christamon S
- 49 Christamon S Unit 17
- 49 Christamon S
- 51 Christamon S
- 53 Christamon S Unit 15
- 37 Christamon S Unit 2
- 33 Christamon S Unit 14
- 33 Christamon S
- 31 Christamon S Unit 13
- 31 Christamon S
- 1 Christamon S
- 12 Christamon S Unit 33
- 58 Christamon S
- 50 Christamon S Unit 51
- 60 Christamon S Unit 43
- 54 Christamon S Unit 40