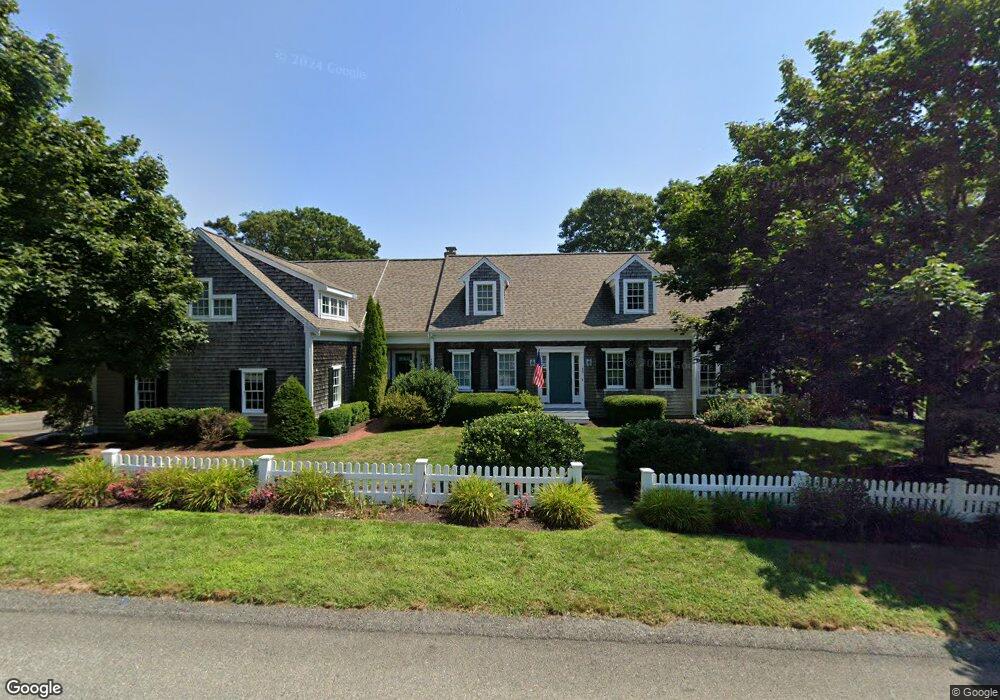
39 Colonial Dr Chatham, MA 02633
West Chatham NeighborhoodEstimated Value: $2,074,000 - $2,294,000
4
Beds
3
Baths
3,701
Sq Ft
$598/Sq Ft
Est. Value
About This Home
This home is located at 39 Colonial Dr, Chatham, MA 02633 and is currently estimated at $2,214,830, approximately $598 per square foot. 39 Colonial Dr is a home located in Barnstable County with nearby schools including Chatham Elementary School, Harwich Elementary School, and Monomoy Regional Middle School.
Ownership History
Date
Name
Owned For
Owner Type
Purchase Details
Closed on
Jun 1, 2004
Sold by
Bono Paul B and Bono Sharon
Bought by
39 Colonial Drive Rt
Current Estimated Value
Purchase Details
Closed on
Jun 6, 1997
Sold by
Colonial Dr Nt and Marsh William
Bought by
Bono Paul B and Bono Sharon B
Create a Home Valuation Report for This Property
The Home Valuation Report is an in-depth analysis detailing your home's value as well as a comparison with similar homes in the area
Home Values in the Area
Average Home Value in this Area
Purchase History
| Date | Buyer | Sale Price | Title Company |
|---|---|---|---|
| 39 Colonial Drive Rt | $975,000 | -- | |
| Bono Paul B | $100,000 | -- |
Source: Public Records
Mortgage History
| Date | Status | Borrower | Loan Amount |
|---|---|---|---|
| Previous Owner | Bono Paul B | $496,900 | |
| Previous Owner | Bono Paul B | $400,000 | |
| Previous Owner | Bono Paul B | $150,000 |
Source: Public Records
Tax History
| Year | Tax Paid | Tax Assessment Tax Assessment Total Assessment is a certain percentage of the fair market value that is determined by local assessors to be the total taxable value of land and additions on the property. | Land | Improvement |
|---|---|---|---|---|
| 2025 | $6,157 | $1,774,400 | $480,100 | $1,294,300 |
| 2024 | $5,976 | $1,673,900 | $452,900 | $1,221,000 |
| 2023 | $5,775 | $1,488,500 | $377,400 | $1,111,100 |
| 2022 | $5,404 | $1,169,600 | $377,400 | $792,200 |
| 2021 | $5,298 | $1,063,800 | $343,000 | $720,800 |
| 2020 | $5,163 | $1,071,100 | $342,900 | $728,200 |
| 2019 | $5,072 | $1,045,800 | $320,600 | $725,200 |
| 2018 | $4,807 | $987,100 | $320,600 | $666,500 |
| 2017 | $4,861 | $966,400 | $311,200 | $655,200 |
| 2016 | $4,795 | $955,100 | $305,100 | $650,000 |
| 2015 | $4,667 | $935,200 | $296,500 | $638,700 |
| 2014 | $4,740 | $933,000 | $296,500 | $636,500 |
Source: Public Records
Map
Nearby Homes
- 39 Jedidiah Way
- 0 Evergreen Ln
- 1805 Main St
- 1761 Main St
- 0 George Ryder Rd Unit 73104629
- 0 George Ryder Rd Unit 22301591
- 1 Seastrand Way Unit 1
- 78 Indian Trail
- 92 Indian Trail
- 20 Jessies Landing
- 2386 Main St
- 44 Buena Vista Rd
- 48 Sylvan Way
- 132 Stage Coach Dr
- 2548 Main St
- 28 Charles St
- 2550 Main St
- 46 Chippingstone Rd
- 0 Tirrells Way
- 28 Lakeview Ave
Your Personal Tour Guide
Ask me questions while you tour the home.