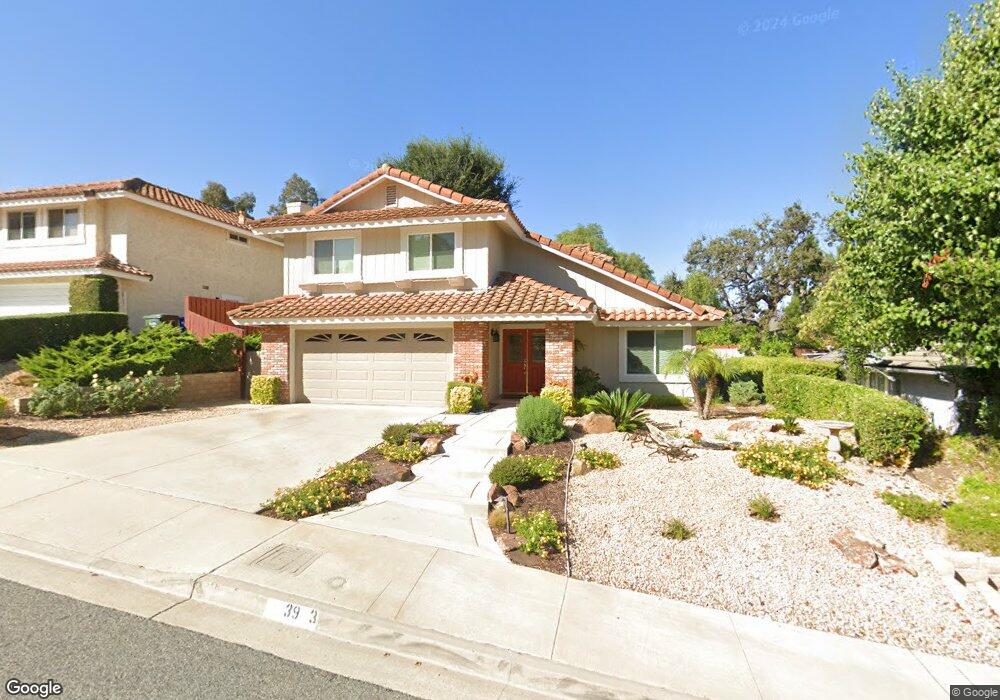
39 Corinne Dr Newbury Park, CA 91320
Estimated Value: $973,000 - $1,134,000
4
Beds
3
Baths
1,832
Sq Ft
$568/Sq Ft
Est. Value
About This Home
This home is located at 39 Corinne Dr, Newbury Park, CA 91320 and is currently estimated at $1,041,191, approximately $568 per square foot. 39 Corinne Dr is a home located in Ventura County with nearby schools including Banyan Elementary School, Sequoia Middle School, and Newbury Park High School.
Ownership History
Date
Name
Owned For
Owner Type
Purchase Details
Closed on
Feb 27, 2015
Sold by
Thomsen Joyce E
Bought by
Thomsen Joyce E
Current Estimated Value
Purchase Details
Closed on
Mar 19, 2014
Sold by
Thomsen Frank J and Thomsen Joyce E
Bought by
Thomsen Joyce E
Home Financials for this Owner
Home Financials are based on the most recent Mortgage that was taken out on this home.
Original Mortgage
$200,000
Interest Rate
3.29%
Mortgage Type
New Conventional
Purchase Details
Closed on
Jan 24, 2014
Sold by
Thomsen Joyce E and Nelson Lois R
Bought by
Thomsen Joyce E
Home Financials for this Owner
Home Financials are based on the most recent Mortgage that was taken out on this home.
Original Mortgage
$200,000
Interest Rate
3.29%
Mortgage Type
New Conventional
Create a Home Valuation Report for This Property
The Home Valuation Report is an in-depth analysis detailing your home's value as well as a comparison with similar homes in the area
Home Values in the Area
Average Home Value in this Area
Purchase History
| Date | Buyer | Sale Price | Title Company |
|---|---|---|---|
| Thomsen Joyce E | -- | None Available | |
| Thomsen Joyce E | -- | Wfg Title Company Of Ca | |
| Thomsen Joyce E | -- | None Available |
Source: Public Records
Mortgage History
| Date | Status | Borrower | Loan Amount |
|---|---|---|---|
| Closed | Thomsen Joyce E | $200,000 |
Source: Public Records
Tax History Compared to Growth
Tax History
| Year | Tax Paid | Tax Assessment Tax Assessment Total Assessment is a certain percentage of the fair market value that is determined by local assessors to be the total taxable value of land and additions on the property. | Land | Improvement |
|---|---|---|---|---|
| 2025 | $4,167 | $302,440 | $105,846 | $196,594 |
| 2024 | $4,167 | $296,510 | $103,770 | $192,740 |
| 2023 | $4,029 | $290,697 | $101,736 | $188,961 |
| 2022 | $3,933 | $284,998 | $99,742 | $185,256 |
| 2021 | $3,833 | $279,410 | $97,786 | $181,624 |
| 2020 | $3,421 | $276,546 | $96,784 | $179,762 |
| 2019 | $3,328 | $271,125 | $94,887 | $176,238 |
| 2018 | $3,256 | $265,810 | $93,027 | $172,783 |
| 2017 | $3,185 | $260,599 | $91,203 | $169,396 |
| 2016 | $3,145 | $255,490 | $89,415 | $166,075 |
| 2015 | $3,084 | $251,655 | $88,073 | $163,582 |
| 2014 | $3,048 | $246,728 | $86,349 | $160,379 |
Source: Public Records
Map
Nearby Homes
- 2742 Borchard Rd Unit 207
- 2775 Edgeview Ct
- 1930 Adrian St
- 251 Asta Ct
- 187 Silas Ave
- 190 Donegal Ave
- 5 S Beatty Place
- 560 Randy Dr
- 538 Dorena Dr
- 3305 Henry Dr
- 59 Sandra Ct
- 585 N Wendy Dr
- 1667 Calle Zafiro Unit 4
- 476 Jeanne Ct
- 627 Evergreen Ave
- 628 Paseo la Perla
- 93 N Dewey Ave
- 149 S Dewey Ave
- 1689 Amador Ln
- 602 Avenida Del Platino