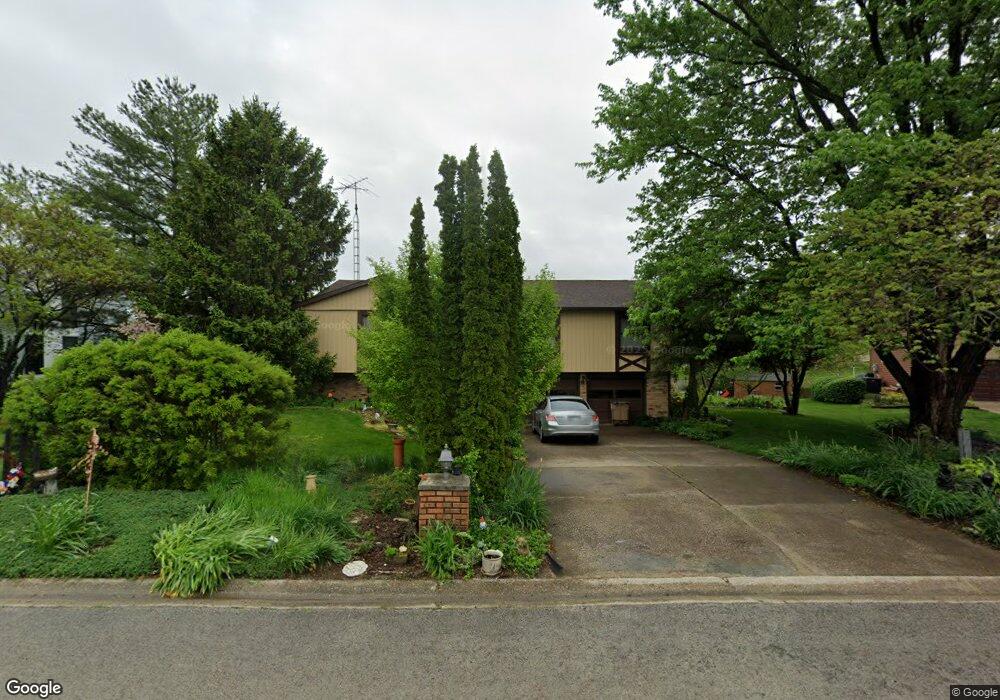
39 Covered Bridge Acres Unit 1 Glenarm, IL 62536
Estimated Value: $220,297 - $319,000
--
Bed
--
Bath
--
Sq Ft
0.51
Acres
About This Home
This home is located at 39 Covered Bridge Acres Unit 1, Glenarm, IL 62536 and is currently estimated at $265,074. 39 Covered Bridge Acres Unit 1 is a home located in Sangamon County with nearby schools including Ball Elementary School, Glenwood Middle School, and Glenwood Intermediate School.
Create a Home Valuation Report for This Property
The Home Valuation Report is an in-depth analysis detailing your home's value as well as a comparison with similar homes in the area
Home Values in the Area
Average Home Value in this Area
Tax History Compared to Growth
Tax History
| Year | Tax Paid | Tax Assessment Tax Assessment Total Assessment is a certain percentage of the fair market value that is determined by local assessors to be the total taxable value of land and additions on the property. | Land | Improvement |
|---|---|---|---|---|
| 2024 | $3,385 | $62,423 | $9,014 | $53,409 |
| 2023 | $3,142 | $56,569 | $8,169 | $48,400 |
| 2022 | $2,942 | $52,769 | $7,620 | $45,149 |
| 2021 | $2,780 | $50,113 | $7,236 | $42,877 |
| 2020 | $2,706 | $49,164 | $7,099 | $42,065 |
| 2019 | $2,594 | $48,238 | $6,965 | $41,273 |
| 2018 | $2,545 | $48,252 | $6,967 | $41,285 |
| 2017 | $2,520 | $48,252 | $6,967 | $41,285 |
| 2016 | $2,478 | $47,723 | $6,891 | $40,832 |
| 2015 | $2,417 | $46,315 | $6,688 | $39,627 |
| 2014 | $2,331 | $44,870 | $6,479 | $38,391 |
| 2013 | $2,231 | $43,542 | $6,287 | $37,255 |
Source: Public Records
Map
Nearby Homes
- 2214 Hopwood Dr
- 10553 S Main St Unit 1
- 404 Sundown Ln
- 203 Huntington Rd
- 108 Kodiak Dr
- 248 Prairie Grass Rd
- 337 Keystone Dr
- 327 Aspen Dr
- 1600 E Spruce St
- 315 Aspen Dr
- 121 Ramblewood Rd
- 448 Wintergreen Dr
- 104 Northwoods Ct
- 318 Ramblewood Rd
- 400 Ramblewood Rd
- 405 Ramblewood Rd
- 401 Ramblewood Rd
- 911 Mesa Dr
- 802 E Locust St
- 309 Dewberry Trail
- 40 Covered Bridge Acres Unit 1
- 19 Covered Bridge Acres
- 38 Covered Bridge Acres Unit 1
- 1 Covered Bridge Acres Unit 1
- 37 Covered Bridge Acres Unit 1
- 79 Covered Bridge Acres Unit 1
- 2 Covered Bridge Acres Unit 1
- 3 Covered Bridge Acres
- 36 Covered Bridge Acres Unit 1
- 78 Covered Bridge Acres Unit 1
- 3 Covered Bridge Acres Unit 1
- 43 Covered Bridge Acres Unit 1
- 42 Covered Bridge Acres Unit 1
- 44 Covered Bridge Acres Unit 1
- 45 Covered Bridge Acres Unit 1
- 4 Covered Bridge Acres Unit 1
- 46 Covered Bridge Acres Unit 1
- 77 Covered Bridge Acres Unit 1
- 0 Covered Bridge Acres
- 34 Covered Bridge Acres