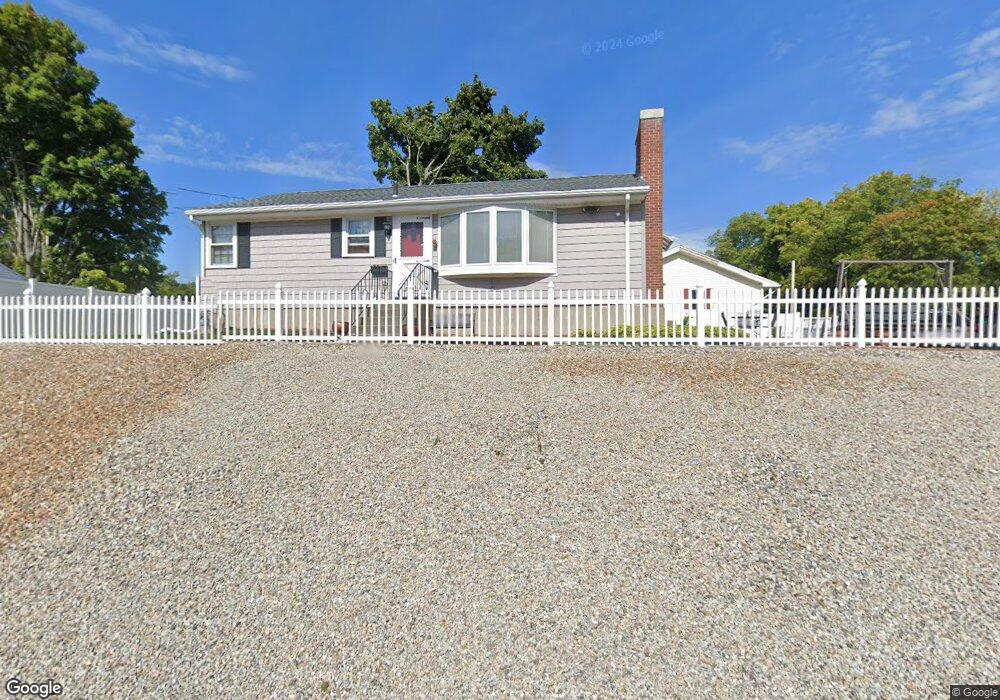
39 Crest Cir Worcester, MA 01603
Webster Square NeighborhoodEstimated Value: $349,000 - $358,646
3
Beds
1
Bath
950
Sq Ft
$374/Sq Ft
Est. Value
About This Home
This home is located at 39 Crest Cir, Worcester, MA 01603 and is currently estimated at $354,912, approximately $373 per square foot. 39 Crest Cir is a home located in Worcester County with nearby schools including Gates Lane, Jacob Hiatt Magnet School, and Chandler Magnet.
Ownership History
Date
Name
Owned For
Owner Type
Purchase Details
Closed on
Sep 10, 2009
Sold by
Us Bk
Bought by
Truong Tan D and Nguyen Linh T
Current Estimated Value
Home Financials for this Owner
Home Financials are based on the most recent Mortgage that was taken out on this home.
Original Mortgage
$111,900
Outstanding Balance
$73,812
Interest Rate
5.36%
Mortgage Type
Purchase Money Mortgage
Estimated Equity
$281,100
Purchase Details
Closed on
Jun 4, 2009
Sold by
Valentin Alexander
Bought by
Us Bk
Purchase Details
Closed on
May 26, 2006
Sold by
Hintlian John L
Bought by
Valentin Alexander
Home Financials for this Owner
Home Financials are based on the most recent Mortgage that was taken out on this home.
Original Mortgage
$176,000
Interest Rate
6.53%
Mortgage Type
Purchase Money Mortgage
Purchase Details
Closed on
Oct 28, 2005
Sold by
Kac Roberta Ann and Balchunas Theodore J
Bought by
Hintlian John L
Create a Home Valuation Report for This Property
The Home Valuation Report is an in-depth analysis detailing your home's value as well as a comparison with similar homes in the area
Home Values in the Area
Average Home Value in this Area
Purchase History
| Date | Buyer | Sale Price | Title Company |
|---|---|---|---|
| Truong Tan D | $139,900 | -- | |
| Us Bk | $152,150 | -- | |
| Valentin Alexander | $220,000 | -- | |
| Hintlian John L | $250,000 | -- |
Source: Public Records
Mortgage History
| Date | Status | Borrower | Loan Amount |
|---|---|---|---|
| Open | Truong Tan D | $111,900 | |
| Previous Owner | Valentin Alexander | $176,000 |
Source: Public Records
Tax History
| Year | Tax Paid | Tax Assessment Tax Assessment Total Assessment is a certain percentage of the fair market value that is determined by local assessors to be the total taxable value of land and additions on the property. | Land | Improvement |
|---|---|---|---|---|
| 2025 | $4,252 | $322,400 | $97,600 | $224,800 |
| 2024 | $4,159 | $302,500 | $97,600 | $204,900 |
| 2023 | $4,027 | $280,800 | $84,800 | $196,000 |
| 2022 | $3,541 | $232,800 | $67,900 | $164,900 |
| 2021 | $3,389 | $208,200 | $54,300 | $153,900 |
| 2020 | $3,247 | $191,000 | $53,900 | $137,100 |
| 2019 | $3,026 | $168,100 | $47,000 | $121,100 |
| 2018 | $2,927 | $154,800 | $47,000 | $107,800 |
| 2017 | $2,920 | $151,900 | $47,000 | $104,900 |
| 2016 | $2,832 | $137,400 | $33,200 | $104,200 |
| 2015 | $2,758 | $137,400 | $33,200 | $104,200 |
| 2014 | $2,685 | $137,400 | $33,200 | $104,200 |
Source: Public Records
Map
Nearby Homes
- 26 Sylvan St
- 32 Goddard Memorial Dr
- 55 Grandview Ave
- 76 Parsons Hill Dr Unit A
- 13 Merchant St
- 103 Henshaw St
- 25 Wyola Dr
- 128 Wildwood Ave
- 23B Timrod Dr
- 35 Genessee St Unit E
- 11 Timrod Dr
- 31 B Gates Rd Unit 22R
- 1511 Main St Unit C405
- 2 Montague St
- 22 Lanark St
- 23 Lakewood St
- 57 1st St
- 34 Scandinavia Ave
- 315 Stafford St
- 27 Havana Rd
Your Personal Tour Guide
Ask me questions while you tour the home.