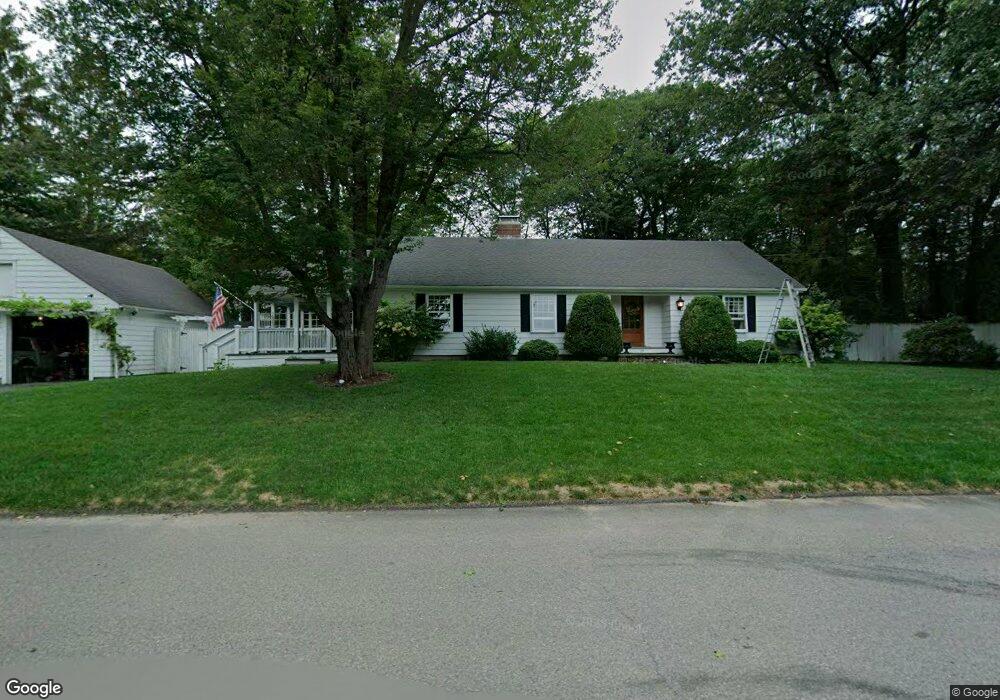
39 David Rd North Attleboro, MA 02760
North Attleboro NeighborhoodEstimated Value: $566,000 - $602,125
3
Beds
3
Baths
1,512
Sq Ft
$389/Sq Ft
Est. Value
About This Home
This home is located at 39 David Rd, North Attleboro, MA 02760 and is currently estimated at $587,781, approximately $388 per square foot. 39 David Rd is a home located in Bristol County with nearby schools including North Attleboro High School and Bishop Feehan High School.
Ownership History
Date
Name
Owned For
Owner Type
Purchase Details
Closed on
Feb 28, 2005
Sold by
Tucker Jean C and Brown Linda C
Bought by
Kummer Kurt L and Kummer Susan
Current Estimated Value
Home Financials for this Owner
Home Financials are based on the most recent Mortgage that was taken out on this home.
Original Mortgage
$200,000
Outstanding Balance
$102,200
Interest Rate
5.73%
Mortgage Type
Purchase Money Mortgage
Estimated Equity
$485,581
Create a Home Valuation Report for This Property
The Home Valuation Report is an in-depth analysis detailing your home's value as well as a comparison with similar homes in the area
Home Values in the Area
Average Home Value in this Area
Purchase History
| Date | Buyer | Sale Price | Title Company |
|---|---|---|---|
| Kummer Kurt L | $327,000 | -- |
Source: Public Records
Mortgage History
| Date | Status | Borrower | Loan Amount |
|---|---|---|---|
| Open | Kummer Kurt L | $200,000 |
Source: Public Records
Tax History Compared to Growth
Tax History
| Year | Tax Paid | Tax Assessment Tax Assessment Total Assessment is a certain percentage of the fair market value that is determined by local assessors to be the total taxable value of land and additions on the property. | Land | Improvement |
|---|---|---|---|---|
| 2025 | $6,286 | $533,200 | $153,100 | $380,100 |
| 2024 | $5,952 | $515,800 | $153,100 | $362,700 |
| 2023 | $5,927 | $463,400 | $159,800 | $303,600 |
| 2022 | $5,392 | $387,100 | $153,100 | $234,000 |
| 2021 | $5,641 | $395,300 | $153,100 | $242,200 |
| 2020 | $5,315 | $370,400 | $153,100 | $217,300 |
| 2019 | $5,078 | $356,600 | $139,300 | $217,300 |
| 2018 | $4,473 | $335,300 | $139,300 | $196,000 |
| 2017 | $4,315 | $326,400 | $139,300 | $187,100 |
| 2016 | $4,256 | $321,900 | $161,500 | $160,400 |
| 2015 | $4,155 | $316,200 | $168,200 | $148,000 |
| 2014 | $3,908 | $295,200 | $147,500 | $147,700 |
Source: Public Records
Map
Nearby Homes
- 0 Anawan Rd
- 50 Metcalf Rd
- 334 S Washington St
- 49 Hoppin Hill Ave
- 40 Sperry Ln
- 30 Sperry Ln Unit Lot 15
- 25 Gregory Way
- 130 E Washington St Unit 84
- 130 E Washington St Unit 71
- 19 Metcalf Cir
- 80 Broadway Unit 9
- 160 Crescent Ave
- 33 Ash St
- 121 E Washington St Unit 13
- 121 E Washington St Unit 11
- 121 E Washington St Unit 12
- 121 E Washington St Unit 8
- 121 E Washington St Unit 6
- 151 Roosevelt Ave Unit A
- 11 Primrose Terrace