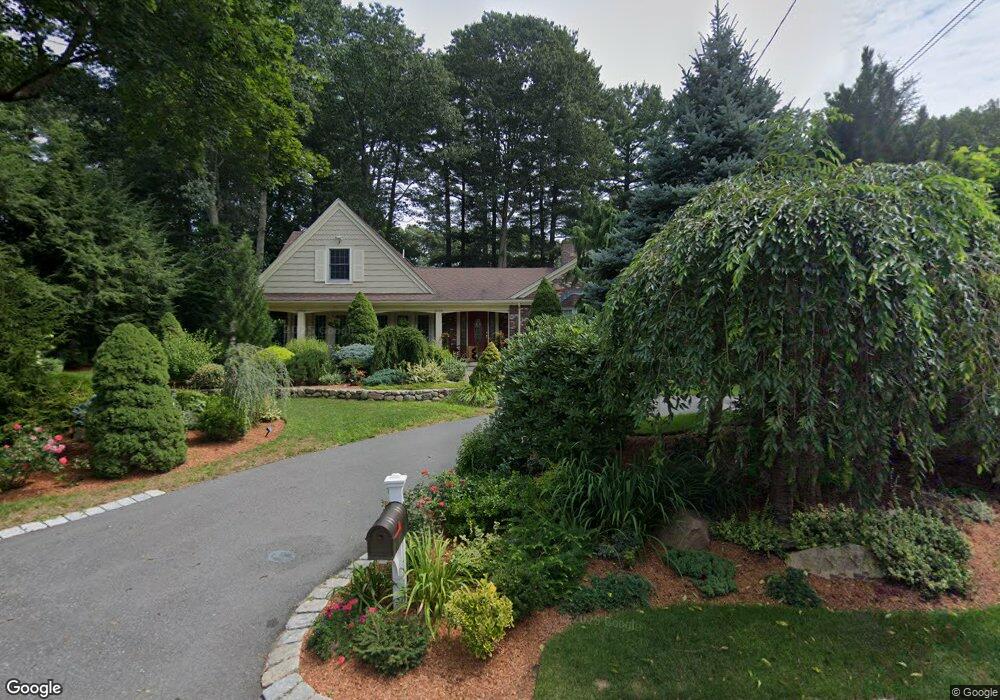
39 Dean Rd Weston, MA 02493
Estimated Value: $1,997,000 - $2,836,000
3
Beds
3
Baths
2,010
Sq Ft
$1,185/Sq Ft
Est. Value
About This Home
This home is located at 39 Dean Rd, Weston, MA 02493 and is currently estimated at $2,380,920, approximately $1,184 per square foot. 39 Dean Rd is a home located in Middlesex County with nearby schools including Country Elementary School, Woodland Elementary School, and Weston Middle School.
Ownership History
Date
Name
Owned For
Owner Type
Purchase Details
Closed on
Aug 28, 2003
Sold by
Dupuy Linda A
Bought by
Ferguson Sreela R and Ferguson Keith P
Current Estimated Value
Home Financials for this Owner
Home Financials are based on the most recent Mortgage that was taken out on this home.
Original Mortgage
$650,000
Outstanding Balance
$290,084
Interest Rate
5.69%
Mortgage Type
Purchase Money Mortgage
Estimated Equity
$2,090,836
Create a Home Valuation Report for This Property
The Home Valuation Report is an in-depth analysis detailing your home's value as well as a comparison with similar homes in the area
Home Values in the Area
Average Home Value in this Area
Purchase History
| Date | Buyer | Sale Price | Title Company |
|---|---|---|---|
| Ferguson Sreela R | $915,000 | -- |
Source: Public Records
Mortgage History
| Date | Status | Borrower | Loan Amount |
|---|---|---|---|
| Open | Ferguson Sreela R | $650,000 |
Source: Public Records
Tax History Compared to Growth
Tax History
| Year | Tax Paid | Tax Assessment Tax Assessment Total Assessment is a certain percentage of the fair market value that is determined by local assessors to be the total taxable value of land and additions on the property. | Land | Improvement |
|---|---|---|---|---|
| 2025 | $19,645 | $1,769,800 | $942,900 | $826,900 |
| 2024 | $18,108 | $1,628,400 | $942,900 | $685,500 |
| 2023 | $17,886 | $1,510,600 | $942,900 | $567,700 |
| 2022 | $17,186 | $1,341,600 | $899,700 | $441,900 |
| 2021 | $30,482 | $1,279,000 | $857,400 | $421,600 |
| 2020 | $31,245 | $1,250,900 | $857,400 | $393,500 |
| 2019 | $14,898 | $1,183,300 | $793,800 | $389,500 |
| 2018 | $14,803 | $1,183,300 | $793,800 | $389,500 |
| 2017 | $30,900 | $1,183,300 | $793,800 | $389,500 |
| 2016 | $14,389 | $1,183,300 | $793,800 | $389,500 |
| 2015 | $13,926 | $1,134,000 | $756,000 | $378,000 |
Source: Public Records
Map
Nearby Homes
- 8 Old Town Rd
- 135 Orchard Ave
- 3 Ravine Rd
- 52 Valley Rd
- 54 Colburn Rd
- 41 Orchard Ave
- 23 Stonecroft Cir
- 25 Columbia St
- 200 Cliff Rd
- 7 Crescent St
- 12 Bird Hill Ave
- 2 Longfellow Rd
- 35 Albion Rd
- 20 Oakland Street Front
- 7 Cliff Rd
- 100 Westcliff Rd
- 45 Moulton St
- 17 Deforest Rd
- 99 Old Colony Rd
- 6 Oakland Cir