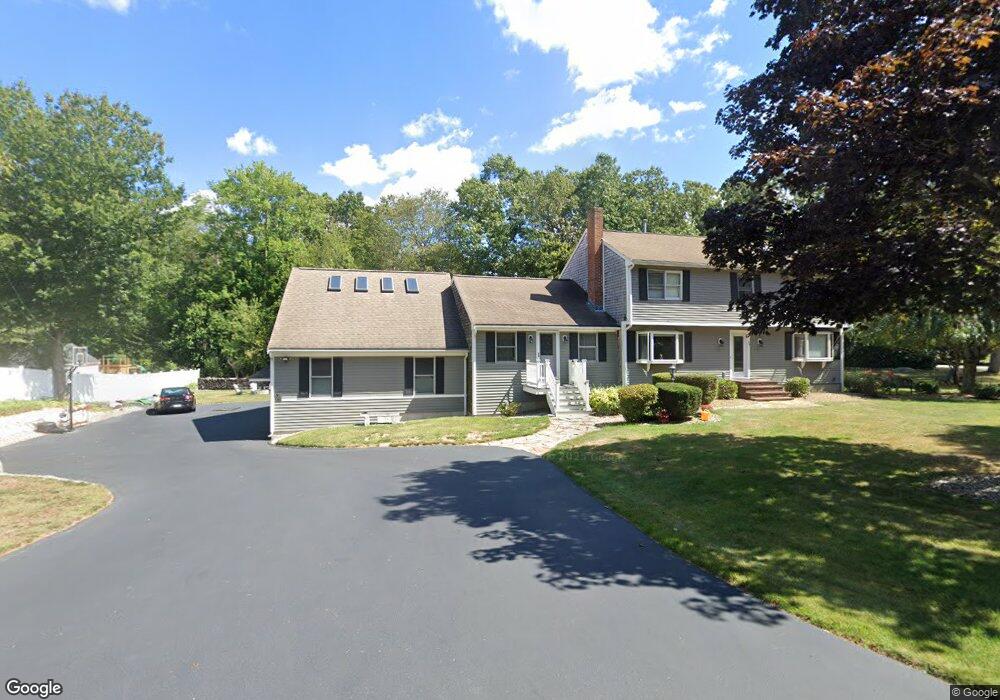
39 Dwelley Ave Hanover, MA 02339
Estimated Value: $960,809 - $1,117,000
4
Beds
2
Baths
3,265
Sq Ft
$316/Sq Ft
Est. Value
About This Home
This home is located at 39 Dwelley Ave, Hanover, MA 02339 and is currently estimated at $1,032,702, approximately $316 per square foot. 39 Dwelley Ave is a home located in Plymouth County with nearby schools including Hanover High School, Calvary Chapel Academy, and Holy Family Elementary School.
Ownership History
Date
Name
Owned For
Owner Type
Purchase Details
Closed on
Mar 2, 2021
Sold by
Currie Jason F and Currie Deborah D
Bought by
Currie Jason F
Current Estimated Value
Purchase Details
Closed on
Aug 7, 2019
Sold by
Bucca Michael J and Bucca Helena
Bought by
Currie Jason F and Currie Deborah D
Home Financials for this Owner
Home Financials are based on the most recent Mortgage that was taken out on this home.
Original Mortgage
$516,000
Interest Rate
3.7%
Mortgage Type
New Conventional
Purchase Details
Closed on
Jul 2, 1992
Sold by
Weymouth Coop Bk
Bought by
Bucca Michael J and Bucca Helena
Purchase Details
Closed on
Feb 25, 1992
Sold by
39 Dwelley Ave T
Bought by
Weymouth Coop Bk
Create a Home Valuation Report for This Property
The Home Valuation Report is an in-depth analysis detailing your home's value as well as a comparison with similar homes in the area
Home Values in the Area
Average Home Value in this Area
Purchase History
| Date | Buyer | Sale Price | Title Company |
|---|---|---|---|
| Currie Jason F | -- | None Available | |
| Currie Jason F | $645,000 | -- | |
| Bucca Michael J | $175,500 | -- | |
| Weymouth Coop Bk | $197,173 | -- |
Source: Public Records
Mortgage History
| Date | Status | Borrower | Loan Amount |
|---|---|---|---|
| Previous Owner | Currie Jason F | $516,000 | |
| Previous Owner | Weymouth Coop Bk | $348,000 |
Source: Public Records
Tax History
| Year | Tax Paid | Tax Assessment Tax Assessment Total Assessment is a certain percentage of the fair market value that is determined by local assessors to be the total taxable value of land and additions on the property. | Land | Improvement |
|---|---|---|---|---|
| 2025 | $10,538 | $853,300 | $268,500 | $584,800 |
| 2024 | $8,896 | $692,800 | $244,100 | $448,700 |
| 2023 | $9,346 | $692,800 | $244,100 | $448,700 |
| 2022 | $10,565 | $692,800 | $244,100 | $448,700 |
| 2021 | $10,386 | $636,000 | $221,900 | $414,100 |
| 2020 | $10,068 | $617,300 | $221,900 | $395,400 |
| 2019 | $9,700 | $591,100 | $221,900 | $369,200 |
| 2018 | $9,016 | $553,800 | $221,900 | $331,900 |
| 2016 | $8,656 | $513,400 | $188,600 | $324,800 |
| 2015 | $8,291 | $513,400 | $188,600 | $324,800 |
Source: Public Records
Map
Nearby Homes
- 206-208 Hinghm St
- 26 Hobart Ln Unit 26,C
- 36 Bayberry Ln
- 1 Von Rhor Dr Unit 1
- 738 Whiting St
- 117 Liberty St
- 48 Bigelow Ave
- 63 Webster St
- 18 Winterberry Ln
- 40 Summit St
- 9 Old Market St
- 47 Stone Meadow Ln
- 303 Pond St
- 44 Stone Meadow Ln
- 7 Boxberry Ln Unit 7
- 12 Dyer St Unit 12
- 737-739 Union St
- 19 Dyer St Unit 19
- 46 Brookwood Rd
- 8 Blueberry Ct
Your Personal Tour Guide
Ask me questions while you tour the home.