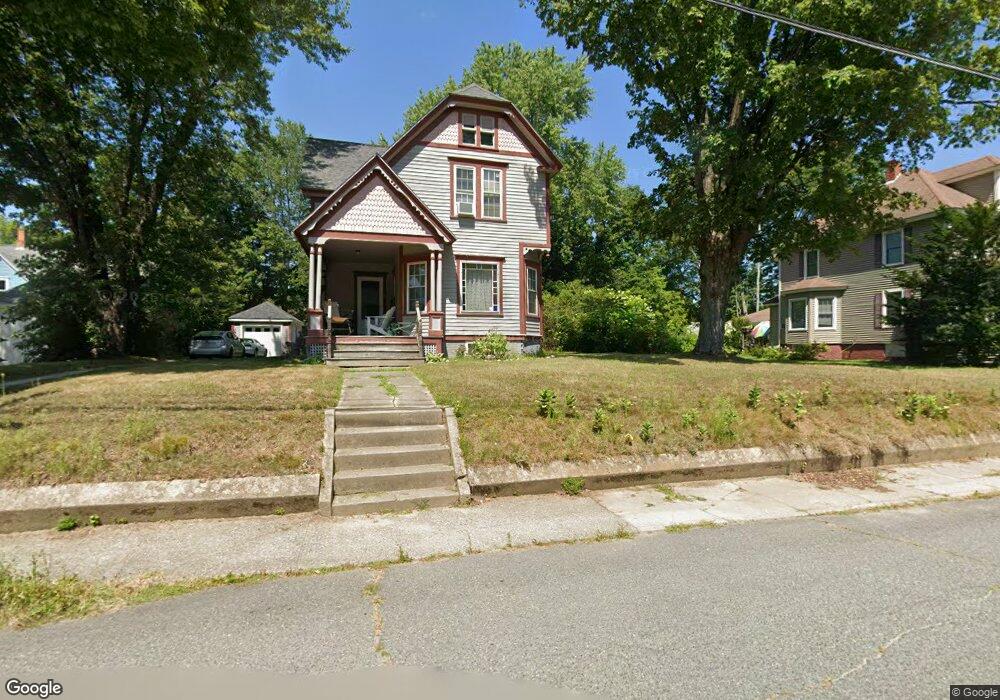
39 E Myrtle St Orange, MA 01364
Estimated Value: $303,734 - $326,000
3
Beds
1
Bath
1,790
Sq Ft
$178/Sq Ft
Est. Value
About This Home
This home is located at 39 E Myrtle St, Orange, MA 01364 and is currently estimated at $318,684, approximately $178 per square foot. 39 E Myrtle St is a home located in Franklin County with nearby schools including Fisher Hill and Ralph C Mahar Regional School.
Ownership History
Date
Name
Owned For
Owner Type
Purchase Details
Closed on
Aug 8, 2011
Sold by
Grout Kathryn J and Grout David J
Bought by
Auffrey Diane M
Current Estimated Value
Purchase Details
Closed on
Oct 23, 2003
Sold by
Grout Kathryn J
Bought by
Grout David John and Grout Kathryn J
Home Financials for this Owner
Home Financials are based on the most recent Mortgage that was taken out on this home.
Original Mortgage
$42,642
Interest Rate
6.29%
Create a Home Valuation Report for This Property
The Home Valuation Report is an in-depth analysis detailing your home's value as well as a comparison with similar homes in the area
Home Values in the Area
Average Home Value in this Area
Purchase History
| Date | Buyer | Sale Price | Title Company |
|---|---|---|---|
| Auffrey Diane M | -- | -- | |
| Grout David John | -- | -- |
Source: Public Records
Mortgage History
| Date | Status | Borrower | Loan Amount |
|---|---|---|---|
| Open | Grout David John | $68,150 | |
| Previous Owner | Grout David John | $6,575 | |
| Previous Owner | Grout David John | $42,642 |
Source: Public Records
Tax History
| Year | Tax Paid | Tax Assessment Tax Assessment Total Assessment is a certain percentage of the fair market value that is determined by local assessors to be the total taxable value of land and additions on the property. | Land | Improvement |
|---|---|---|---|---|
| 2025 | $46 | $279,300 | $25,200 | $254,100 |
| 2024 | $4,257 | $244,100 | $25,200 | $218,900 |
| 2023 | $3,824 | $212,900 | $22,700 | $190,200 |
| 2022 | $3,453 | $180,600 | $22,700 | $157,900 |
| 2021 | $3,382 | $168,700 | $42,800 | $125,900 |
| 2020 | $3,222 | $158,500 | $39,100 | $119,400 |
| 2019 | $3,162 | $140,400 | $33,800 | $106,600 |
| 2018 | $2,808 | $128,000 | $31,500 | $96,500 |
| 2017 | $2,717 | $128,000 | $31,500 | $96,500 |
| 2016 | $2,563 | $118,100 | $28,200 | $89,900 |
| 2015 | $2,220 | $106,900 | $30,000 | $76,900 |
| 2014 | $2,284 | $115,700 | $30,000 | $85,700 |
Source: Public Records
Map
Nearby Homes
Your Personal Tour Guide
Ask me questions while you tour the home.