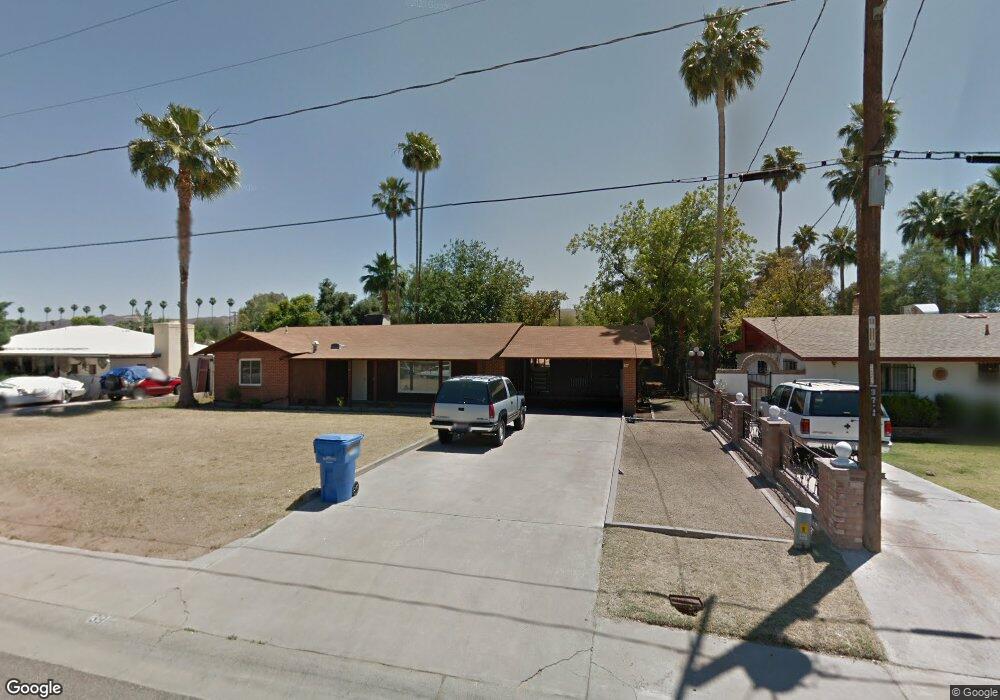
39 E Saint Charles Ave Phoenix, AZ 85042
South Mountain NeighborhoodEstimated Value: $368,093 - $463,000
Studio
2
Baths
1,859
Sq Ft
$226/Sq Ft
Est. Value
About This Home
This home is located at 39 E Saint Charles Ave, Phoenix, AZ 85042 and is currently estimated at $421,023, approximately $226 per square foot. 39 E Saint Charles Ave is a home located in Maricopa County with nearby schools including John F. Kennedy Elementary School, C O Greenfield School, and South Mountain High School.
Ownership History
Date
Name
Owned For
Owner Type
Purchase Details
Closed on
Dec 19, 2023
Sold by
Moore Kathy Renee
Bought by
Moore Justin
Current Estimated Value
Purchase Details
Closed on
Dec 15, 2023
Sold by
Moore Kathy Renee
Bought by
Moore Justin
Purchase Details
Closed on
May 13, 2013
Sold by
Rogers Rose and Moore Kathy Renee
Bought by
Moore Kathy Renee and Moore Terri Lyn
Purchase Details
Closed on
Apr 3, 2006
Sold by
Moore William E
Bought by
Moore William Edward and William Edward Moore Family Living Trust
Home Financials for this Owner
Home Financials are based on the most recent Mortgage that was taken out on this home.
Original Mortgage
$60,000
Interest Rate
6.25%
Mortgage Type
New Conventional
Purchase Details
Closed on
Dec 3, 2003
Sold by
Moore William E and Moore William Edward
Bought by
Moore William Edward and William Edward Moore Family Living Trust
Purchase Details
Closed on
Feb 6, 1996
Sold by
Moore Barbara Lucille
Bought by
Moore William E
Home Financials for this Owner
Home Financials are based on the most recent Mortgage that was taken out on this home.
Original Mortgage
$37,868
Interest Rate
6.99%
Create a Home Valuation Report for This Property
The Home Valuation Report is an in-depth analysis detailing your home's value as well as a comparison with similar homes in the area
Home Values in the Area
Average Home Value in this Area
Purchase History
We collect this data history from publicly available records. To have your information removed, we recommend requesting removal directly through your county’s website.
| Date | Buyer | Sale Price | Title Company |
|---|---|---|---|
| Moore Justin | -- | None Listed On Document | |
| Moore Justin | -- | None Listed On Document | |
| Moore Kathy Renee | -- | None Available | |
| Moore William Edward | -- | None Available | |
| Moore William E | -- | American Title Svc Agency Ll | |
| Moore William Edward | -- | -- | |
| Moore William E | -- | Stewart Title & Trust |
Source: Public Records
Mortgage History
We collect this data history from publicly available records. To have your information removed, we recommend requesting removal directly through your county’s website.
| Date | Status | Borrower | Loan Amount |
|---|---|---|---|
| Previous Owner | Moore William E | $60,000 | |
| Previous Owner | Moore William E | $37,868 |
Source: Public Records
Tax History
| Year | Tax Paid | Tax Assessment Tax Assessment Total Assessment is a certain percentage of the fair market value that is determined by local assessors to be the total taxable value of land and additions on the property. | Land | Improvement |
|---|---|---|---|---|
| 2025 | $1,073 | $7,936 | -- | -- |
| 2024 | $1,013 | $7,558 | -- | -- |
| 2023 | $1,013 | $30,230 | $6,040 | $24,190 |
| 2022 | $992 | $23,250 | $4,650 | $18,600 |
| 2021 | $1,023 | $20,250 | $4,050 | $16,200 |
| 2020 | $1,011 | $19,230 | $3,840 | $15,390 |
| 2019 | $976 | $17,300 | $3,460 | $13,840 |
| 2018 | $948 | $15,000 | $3,000 | $12,000 |
| 2017 | $884 | $14,670 | $2,930 | $11,740 |
| 2016 | $839 | $11,580 | $2,310 | $9,270 |
| 2015 | $779 | $9,660 | $1,930 | $7,730 |
Source: Public Records
Map
Nearby Homes
- 21 E Saint Charles Ave
- 111 E Southern Ave
- 6410 S 7th St
- 7015 S 5th Ave
- 718 E Carter Rd
- 506 E Southern Ave
- 314 W Minton St
- 418 E Hidalgo Ave
- 29 E Baseline Rd
- 6033 S 7th Ave
- 6812 S 8th Dr Unit 3
- 101 W Harwell Rd
- 5437 S 4th St
- 111 W Chambers St
- 6630 S 11th St Unit 1
- 6434 S 10th Dr
- 5233 S Central Ave
- 6929 S 11th Dr
- 5244 S Montezuma St
- 17 W Roeser Rd
- 38 E Saint Charles Ave
- 32 E Saint Charles Ave
- 44 E Saint Charles Ave
- 26 E Saint Charles Ave
- 35 E Saint Anne Ave
- 31 E Saint Anne Ave
- 45 E Saint Anne Ave
- 37 E Saint Charles Ave
- 25 E Saint Anne Ave
- 47 E Saint Charles Ave
- 104 E Saint Charles Ave
- 25 E Saint Charles Ave
- 25 E Saint Charles Ave
- 101 E Saint Charles Ave
- 19 E Saint Anne Ave
- 101 E Saint Anne Ave
- 16 E Saint Charles Ave
- 110 E Saint Charles Ave
- 15 E Saint Anne Ave
- 34 E Saint Anne Ave
Your Personal Tour Guide
Ask me questions while you tour the home.