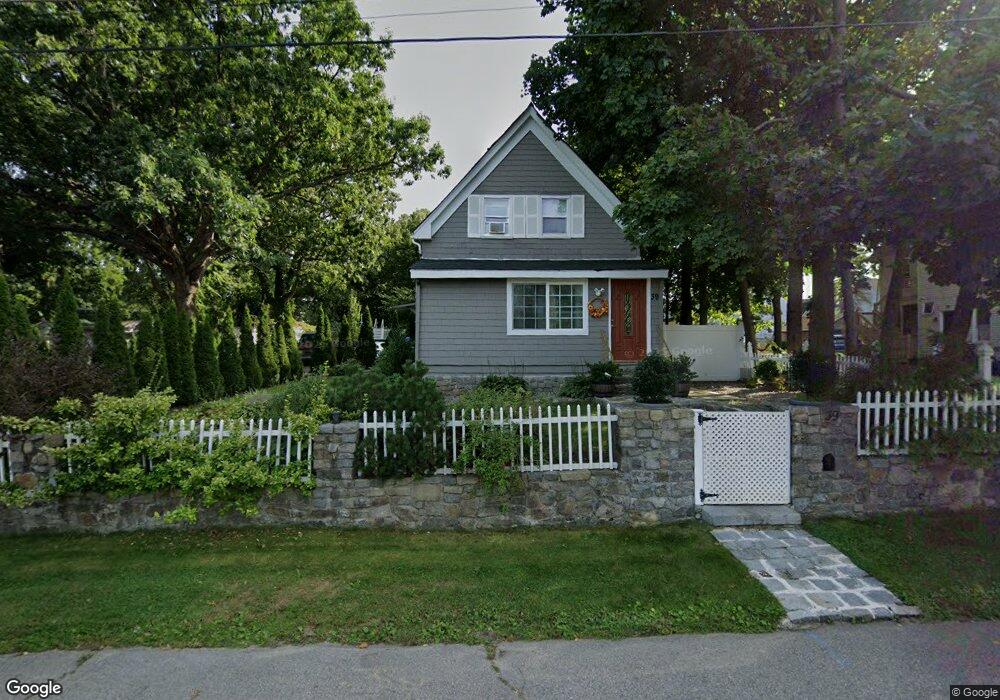
39 E Union St Brockton, MA 02302
Clifton Heights NeighborhoodEstimated Value: $416,000 - $544,000
3
Beds
1
Bath
1,464
Sq Ft
$332/Sq Ft
Est. Value
About This Home
This home is located at 39 E Union St, Brockton, MA 02302 and is currently estimated at $486,111, approximately $332 per square foot. 39 E Union St is a home located in Plymouth County with nearby schools including Gilmore Elementary School, Davis K-8 School, and John F. Kennedy Elementary School.
Ownership History
Date
Name
Owned For
Owner Type
Purchase Details
Closed on
Aug 15, 2000
Sold by
Ortiz Martine M
Bought by
Laneiro Silvestre M
Current Estimated Value
Home Financials for this Owner
Home Financials are based on the most recent Mortgage that was taken out on this home.
Original Mortgage
$120,250
Interest Rate
8.21%
Mortgage Type
Purchase Money Mortgage
Purchase Details
Closed on
Sep 27, 1991
Sold by
Marble Lyman F and Marble Patricia A
Bought by
Ortiz Martine M
Create a Home Valuation Report for This Property
The Home Valuation Report is an in-depth analysis detailing your home's value as well as a comparison with similar homes in the area
Home Values in the Area
Average Home Value in this Area
Purchase History
| Date | Buyer | Sale Price | Title Company |
|---|---|---|---|
| Laneiro Silvestre M | $124,000 | -- | |
| Ortiz Martine M | $89,900 | -- |
Source: Public Records
Mortgage History
| Date | Status | Borrower | Loan Amount |
|---|---|---|---|
| Open | Ortiz Martine M | $25,000 | |
| Open | Ortiz Martine M | $149,000 | |
| Closed | Ortiz Martine M | $126,000 | |
| Closed | Ortiz Martine M | $120,250 |
Source: Public Records
Tax History
| Year | Tax Paid | Tax Assessment Tax Assessment Total Assessment is a certain percentage of the fair market value that is determined by local assessors to be the total taxable value of land and additions on the property. | Land | Improvement |
|---|---|---|---|---|
| 2025 | $5,150 | $425,300 | $141,100 | $284,200 |
| 2024 | $4,834 | $402,200 | $141,100 | $261,100 |
| 2023 | $4,775 | $367,900 | $109,100 | $258,800 |
| 2022 | $4,313 | $308,700 | $99,200 | $209,500 |
| 2021 | $4,015 | $276,900 | $83,500 | $193,400 |
| 2020 | $3,627 | $239,400 | $77,200 | $162,200 |
| 2019 | $3,464 | $222,900 | $75,000 | $147,900 |
| 2018 | $3,066 | $190,900 | $75,000 | $115,900 |
| 2017 | $3,170 | $196,900 | $75,000 | $121,900 |
| 2016 | $2,960 | $170,500 | $73,000 | $97,500 |
| 2015 | $2,935 | $161,700 | $73,000 | $88,700 |
| 2014 | $2,884 | $159,100 | $73,000 | $86,100 |
Source: Public Records
Map
Nearby Homes
Your Personal Tour Guide
Ask me questions while you tour the home.