
Seller's Agent in 2023
Henry Choi
Real Broker MA, LLC
(617) 398-7783
1 in this area
29 Total Sales
Estimated Value: $490,161 - $574,000
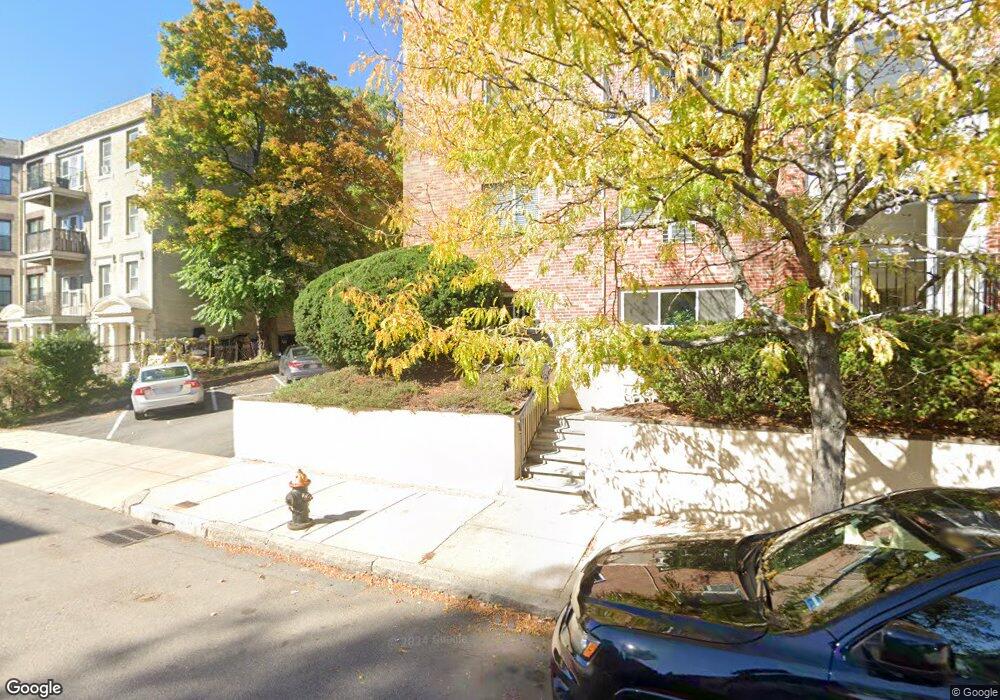
Available 9/01: FURNISHED - Located on the Brighton/Brookline line in Cleveland Circle in a professionally managed building! Condo has modern appliances, open floor plan, is in an elevator building with a deck with beautiful views to enjoy a breath of fresh air. Unit has good sized bedrooms and washer in unit, well as laundry in building. Near to T(Greenline C&D lines), Bus routes (65, 501, 86), Storrow Drive & I-90, restaurants, shops and Boston College. Easy commute to Longwood Medical area being so close to D line train stop. Near whole foods, star market, chestnut hill, Cleveland circle & Washington Square.
| Date | Buyer | Sale Price | Title Company |
|---|---|---|---|
| Wang Peihu | $388,000 | -- | |
| Pettipaw Lisa | $253,000 | -- |
| Date | Status | Borrower | Loan Amount |
|---|---|---|---|
| Previous Owner | Pettipaw Lisa | $200,000 |
| Date | Event | Price | List to Sale | Price per Sq Ft | Prior Sale |
|---|---|---|---|---|---|
| 06/15/2023 06/15/23 | Rented | $3,000 | 0.0% | -- | |
| 06/06/2023 06/06/23 | Under Contract | -- | -- | -- | |
| 05/26/2023 05/26/23 | For Rent | $3,000 | +11.1% | -- | |
| 03/15/2022 03/15/22 | For Rent | $2,700 | 0.0% | -- | |
| 10/08/2015 10/08/15 | Sold | $388,000 | +3.5% | $501 / Sq Ft | View Prior Sale |
| 09/18/2015 09/18/15 | Pending | -- | -- | -- | |
| 09/09/2015 09/09/15 | For Sale | $375,000 | -- | $484 / Sq Ft |
| Year | Tax Paid | Tax Assessment Tax Assessment Total Assessment is a certain percentage of the fair market value that is determined by local assessors to be the total taxable value of land and additions on the property. | Land | Improvement |
|---|---|---|---|---|
| 2025 | $4,639 | $400,600 | $0 | $400,600 |
| 2024 | $4,350 | $399,100 | $0 | $399,100 |
| 2023 | $4,286 | $399,100 | $0 | $399,100 |
| 2022 | $4,097 | $376,600 | $0 | $376,600 |
| 2021 | $3,977 | $372,700 | $0 | $372,700 |
| 2020 | $3,749 | $355,000 | $0 | $355,000 |
| 2019 | $3,668 | $348,000 | $0 | $348,000 |
| 2018 | $3,410 | $325,400 | $0 | $325,400 |
| 2017 | $3,191 | $301,300 | $0 | $301,300 |
| 2016 | $3,040 | $276,400 | $0 | $276,400 |
| 2015 | $3,346 | $276,300 | $0 | $276,300 |
| 2014 | $3,159 | $251,100 | $0 | $251,100 |
Seller's Agent in 2023
Henry Choi
Real Broker MA, LLC
(617) 398-7783
1 in this area
29 Total Sales
M
Buyer's Agent in 2023
Micah Snyder
Red Tree Real Estate
(617) 393-5499
1 Total Sale
R
Seller's Agent in 2015
Ruth Lerner
Compass
J
Buyer's Agent in 2015
Jenny Zhao
Realty Premiere
(617) 966-0206
1 Total Sale