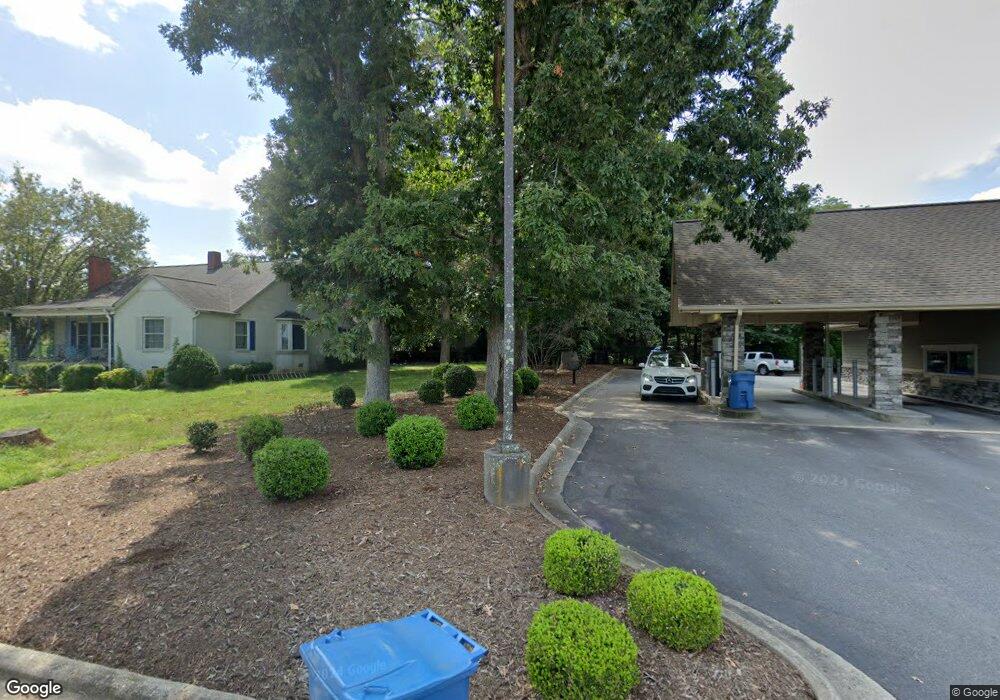
39 Falls Ave Granite Falls, NC 28630
Estimated Value: $335,000 - $560,425
4
Beds
3
Baths
3,073
Sq Ft
$159/Sq Ft
Est. Value
About This Home
This home is located at 39 Falls Ave, Granite Falls, NC 28630 and is currently estimated at $487,356, approximately $158 per square foot. 39 Falls Ave is a home located in Caldwell County with nearby schools including Granite Falls Elementary School, South Caldwell High School, and Granite Falls Middle School.
Ownership History
Date
Name
Owned For
Owner Type
Purchase Details
Closed on
Sep 25, 2025
Sold by
Bell Bradley K and Keller Douglas W
Bought by
Bell Bradley K
Current Estimated Value
Home Financials for this Owner
Home Financials are based on the most recent Mortgage that was taken out on this home.
Original Mortgage
$356,125
Outstanding Balance
$355,808
Interest Rate
6.58%
Mortgage Type
FHA
Estimated Equity
$131,548
Purchase Details
Closed on
May 18, 2021
Sold by
Bell Amber N
Bought by
Bell Bradley K
Purchase Details
Closed on
Jul 29, 2016
Sold by
Vanvanperry Ronnie Van and Perry Sally E
Bought by
Bell Bradley K and Bell Amber N
Home Financials for this Owner
Home Financials are based on the most recent Mortgage that was taken out on this home.
Original Mortgage
$265,500
Interest Rate
3.41%
Mortgage Type
New Conventional
Purchase Details
Closed on
Apr 14, 2005
Sold by
Johnson Bill R and Johnson Terrie L
Bought by
Perry Ronnie and Perry Sally E
Create a Home Valuation Report for This Property
The Home Valuation Report is an in-depth analysis detailing your home's value as well as a comparison with similar homes in the area
Home Values in the Area
Average Home Value in this Area
Purchase History
| Date | Buyer | Sale Price | Title Company |
|---|---|---|---|
| Bell Bradley K | -- | None Listed On Document | |
| Bell Bradley K | -- | None Available | |
| Bell Bradley K | $280,000 | None Available | |
| Perry Ronnie | $208,000 | None Available |
Source: Public Records
Mortgage History
| Date | Status | Borrower | Loan Amount |
|---|---|---|---|
| Open | Bell Bradley K | $356,125 | |
| Previous Owner | Bell Bradley K | $265,500 |
Source: Public Records
Tax History
| Year | Tax Paid | Tax Assessment Tax Assessment Total Assessment is a certain percentage of the fair market value that is determined by local assessors to be the total taxable value of land and additions on the property. | Land | Improvement |
|---|---|---|---|---|
| 2025 | $2,150 | $557,100 | $20,100 | $537,000 |
| 2024 | $22 | $338,400 | $20,100 | $318,300 |
| 2023 | $2,150 | $338,400 | $20,100 | $318,300 |
| 2022 | $2,107 | $338,400 | $20,100 | $318,300 |
| 2021 | $2,107 | $338,400 | $20,100 | $318,300 |
| 2020 | $1,099 | $171,600 | $24,500 | $147,100 |
| 2019 | $1,099 | $171,600 | $24,500 | $147,100 |
| 2018 | $1,868 | $171,600 | $0 | $0 |
| 2017 | $1,868 | $171,600 | $0 | $0 |
| 2016 | $1,113 | $171,600 | $0 | $0 |
| 2015 | $1,057 | $171,600 | $0 | $0 |
| 2014 | $1,057 | $171,600 | $0 | $0 |
Source: Public Records
Map
Nearby Homes
- 2 Sterling Ave
- 40 Forest Ave
- 0 Hickory Blvd
- 0 Highway 321
- 20 Archer St
- 14 Berkley Ave
- 7 Forest Ave
- 62 Duke St Unit 3
- 18 Berkley Ave
- 109 S Main St
- 28 Central Ave
- 32 Pearl St
- 80 Duke St
- 0 Leeward Ln Unit CAR4334362
- 3155 Frederick Place
- 4002 Hickory Blvd
- 6 Woods Dr
- 126 N Main St
- 10 Riverview Cir
- 84 Lakeside Ave Unit Lots 6 & 7
Your Personal Tour Guide
Ask me questions while you tour the home.