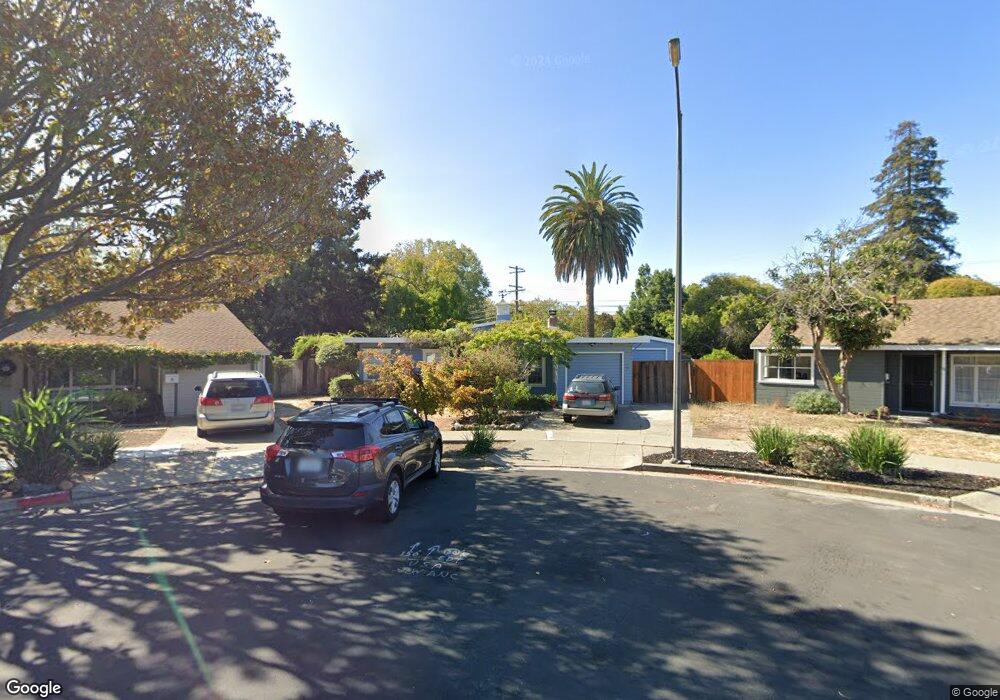
39 Flower St Redwood City, CA 94063
Centennial NeighborhoodEstimated Value: $1,417,000 - $1,602,642
3
Beds
1
Bath
980
Sq Ft
$1,541/Sq Ft
Est. Value
About This Home
This home is located at 39 Flower St, Redwood City, CA 94063 and is currently estimated at $1,509,911, approximately $1,540 per square foot. 39 Flower St is a home located in San Mateo County with nearby schools including Clifford School, John F. Kennedy Middle School, and Sequoia High School.
Ownership History
Date
Name
Owned For
Owner Type
Purchase Details
Closed on
Jun 3, 2023
Sold by
Nobs Carol J
Bought by
Carol Jane Nobs Revocable Trust and Nobs
Current Estimated Value
Purchase Details
Closed on
Jun 26, 1997
Sold by
Du Bray John W and Du Mary E
Bought by
Nobs Carol J
Home Financials for this Owner
Home Financials are based on the most recent Mortgage that was taken out on this home.
Original Mortgage
$200,000
Interest Rate
7.35%
Create a Home Valuation Report for This Property
The Home Valuation Report is an in-depth analysis detailing your home's value as well as a comparison with similar homes in the area
Home Values in the Area
Average Home Value in this Area
Purchase History
| Date | Buyer | Sale Price | Title Company |
|---|---|---|---|
| Carol Jane Nobs Revocable Trust | -- | None Listed On Document | |
| Nobs Carol J | $310,000 | Old Republic Title Ins Compa |
Source: Public Records
Mortgage History
| Date | Status | Borrower | Loan Amount |
|---|---|---|---|
| Previous Owner | Nobs Carol J | $200,000 |
Source: Public Records
Tax History Compared to Growth
Tax History
| Year | Tax Paid | Tax Assessment Tax Assessment Total Assessment is a certain percentage of the fair market value that is determined by local assessors to be the total taxable value of land and additions on the property. | Land | Improvement |
|---|---|---|---|---|
| 2025 | $6,571 | $494,970 | $247,485 | $247,485 |
| 2023 | $6,571 | $475,752 | $237,876 | $237,876 |
| 2022 | $6,139 | $466,424 | $233,212 | $233,212 |
| 2021 | $5,018 | $457,280 | $228,640 | $228,640 |
| 2020 | $4,951 | $452,592 | $226,296 | $226,296 |
| 2019 | $4,931 | $443,718 | $221,859 | $221,859 |
| 2018 | $4,803 | $435,018 | $217,509 | $217,509 |
| 2017 | $4,750 | $426,490 | $213,245 | $213,245 |
| 2016 | $4,655 | $418,128 | $209,064 | $209,064 |
| 2015 | $4,482 | $411,848 | $205,924 | $205,924 |
| 2014 | $4,395 | $403,782 | $201,891 | $201,891 |
Source: Public Records
Map
Nearby Homes
- 112 F St
- 1761 Laurel St
- 55 Claremont Ave Unit 301
- 136 Finger Ave Unit 138
- 1140 Whipple Ave Unit 21
- 1140 Whipple Ave Unit 22
- 35 Arch St
- 125 Warwick St
- 503 Arlington Rd
- 1463 Greenwood Ave
- 630 Bair Island Rd Unit 106
- 636 Fan Tail Way Unit 905
- 1400 Oakhurst Ave
- 641 Turnbuckle Dr Unit 1701
- 161 Jeter St
- 1471 Cordilleras Ave
- 329 Oakview Dr
- 464 Clinton St Unit 309
- 352 Oakview Dr
- 373 Oakview Dr