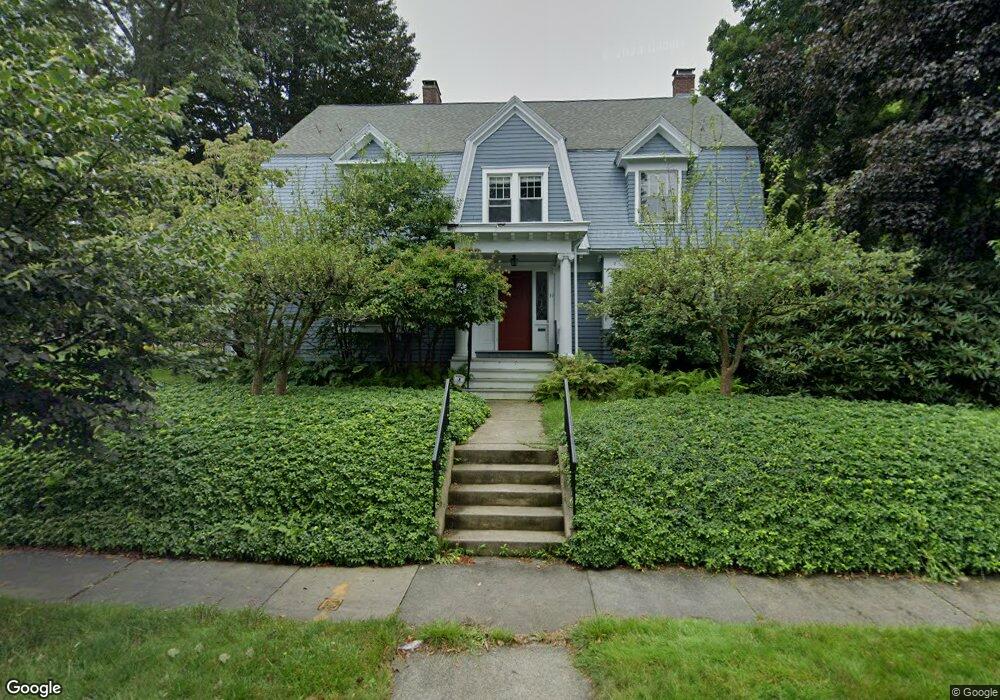
39 Forest St Worcester, MA 01609
Forest Grove NeighborhoodEstimated Value: $858,495 - $931,000
7
Beds
5
Baths
3,696
Sq Ft
$243/Sq Ft
Est. Value
About This Home
This home is located at 39 Forest St, Worcester, MA 01609 and is currently estimated at $899,874, approximately $243 per square foot. 39 Forest St is a home located in Worcester County with nearby schools including Nelson Place Elementary School, Jacob Hiatt Magnet School, and Chandler Magnet.
Ownership History
Date
Name
Owned For
Owner Type
Purchase Details
Closed on
Dec 12, 2011
Sold by
Mountain Thomas R
Bought by
Waschek Matthias and Taviner Steven
Current Estimated Value
Home Financials for this Owner
Home Financials are based on the most recent Mortgage that was taken out on this home.
Original Mortgage
$292,600
Outstanding Balance
$205,622
Interest Rate
4.09%
Mortgage Type
Purchase Money Mortgage
Estimated Equity
$694,252
Create a Home Valuation Report for This Property
The Home Valuation Report is an in-depth analysis detailing your home's value as well as a comparison with similar homes in the area
Home Values in the Area
Average Home Value in this Area
Purchase History
| Date | Buyer | Sale Price | Title Company |
|---|---|---|---|
| Waschek Matthias | $308,000 | -- |
Source: Public Records
Mortgage History
| Date | Status | Borrower | Loan Amount |
|---|---|---|---|
| Open | Waschek Matthias | $292,600 |
Source: Public Records
Tax History
| Year | Tax Paid | Tax Assessment Tax Assessment Total Assessment is a certain percentage of the fair market value that is determined by local assessors to be the total taxable value of land and additions on the property. | Land | Improvement |
|---|---|---|---|---|
| 2025 | $9,774 | $741,000 | $125,400 | $615,600 |
| 2024 | $9,338 | $679,100 | $125,400 | $553,700 |
| 2023 | $9,096 | $634,300 | $108,100 | $526,200 |
| 2022 | $8,551 | $562,200 | $86,700 | $475,500 |
| 2021 | $6,885 | $422,900 | $69,600 | $353,300 |
| 2020 | $7,186 | $422,700 | $69,400 | $353,300 |
| 2019 | $7,657 | $425,400 | $67,200 | $358,200 |
| 2018 | $7,534 | $398,400 | $67,200 | $331,200 |
| 2017 | $7,523 | $391,400 | $67,200 | $324,200 |
| 2016 | $7,797 | $378,300 | $56,900 | $321,400 |
| 2015 | $7,592 | $378,300 | $56,900 | $321,400 |
| 2014 | $5,973 | $305,700 | $56,900 | $248,800 |
Source: Public Records
Map
Nearby Homes
- 59 Beechmont St
- 7 Chadwick St
- 40 Westwood Dr
- 8 Old Colony Rd
- 11 Balder Rd
- 36 Eagle Rd
- 14 Balder Rd
- 23 Dryden St
- 3 Westwood Dr
- 577 Grove St
- 6 Milton St
- 42 Ellis Dr
- 93 Newton Ave N
- 437 Salisbury St
- 50 Valley Hill Dr
- 63 North St Unit D
- 63 North St Unit C
- 63 North St Unit B
- 63 North St Unit A
- 46 Hastings Ave
Your Personal Tour Guide
Ask me questions while you tour the home.