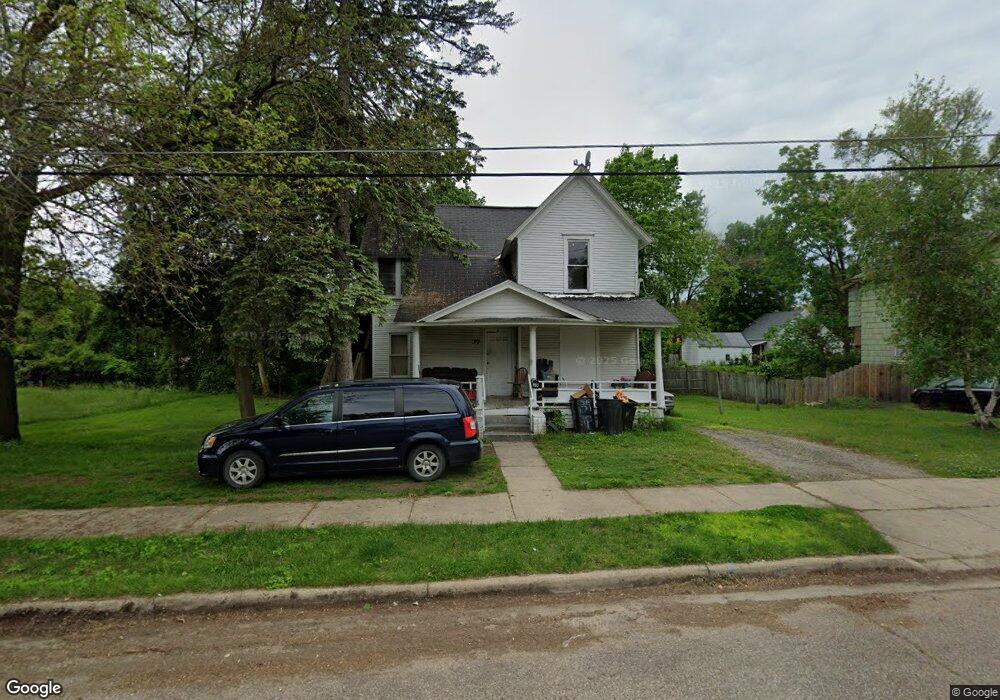
39 Franklin St Battle Creek, MI 49017
Northeast Battle Creek NeighborhoodEstimated Value: $90,000 - $108,000
2
Beds
2
Baths
1,590
Sq Ft
$63/Sq Ft
Est. Value
About This Home
This home is located at 39 Franklin St, Battle Creek, MI 49017 and is currently estimated at $100,667, approximately $63 per square foot. 39 Franklin St is a home located in Calhoun County with nearby schools including Northwestern Middle School, Battle Creek Central High School, and St. Philip Catholic Central High School.
Ownership History
Date
Name
Owned For
Owner Type
Purchase Details
Closed on
Sep 26, 2025
Sold by
Schwark Rick
Bought by
Vinzant Brian
Current Estimated Value
Purchase Details
Closed on
Dec 6, 2011
Sold by
Long Chester and Chester Long Revocable Trust
Bought by
Schwark Rick
Purchase Details
Closed on
Nov 25, 2000
Sold by
Long Betty R
Purchase Details
Closed on
Nov 8, 1996
Bought by
Long Co-Trustees
Purchase Details
Closed on
Nov 9, 1995
Bought by
Long
Create a Home Valuation Report for This Property
The Home Valuation Report is an in-depth analysis detailing your home's value as well as a comparison with similar homes in the area
Home Values in the Area
Average Home Value in this Area
Purchase History
| Date | Buyer | Sale Price | Title Company |
|---|---|---|---|
| Vinzant Brian | $40,000 | Ata National Title Group | |
| Schwark Rick | -- | None Available | |
| -- | -- | -- | |
| Long Co-Trustees | -- | -- | |
| Long | $12,500 | -- |
Source: Public Records
Tax History Compared to Growth
Tax History
| Year | Tax Paid | Tax Assessment Tax Assessment Total Assessment is a certain percentage of the fair market value that is determined by local assessors to be the total taxable value of land and additions on the property. | Land | Improvement |
|---|---|---|---|---|
| 2025 | -- | $35,700 | $0 | $0 |
| 2024 | $1,419 | $37,309 | $0 | $0 |
| 2023 | $1,167 | $37,681 | $0 | $0 |
| 2022 | $829 | $30,946 | $0 | $0 |
| 2021 | $1,108 | $23,854 | $0 | $0 |
| 2020 | $1,063 | $19,140 | $0 | $0 |
| 2019 | $1,057 | $16,531 | $0 | $0 |
| 2018 | $1,057 | $16,620 | $607 | $16,013 |
| 2017 | $1,029 | $16,421 | $0 | $0 |
| 2016 | $1,027 | $16,157 | $0 | $0 |
| 2015 | $1,176 | $15,674 | $1,474 | $14,200 |
| 2014 | $1,176 | $18,295 | $1,474 | $16,821 |
Source: Public Records
Map
Nearby Homes