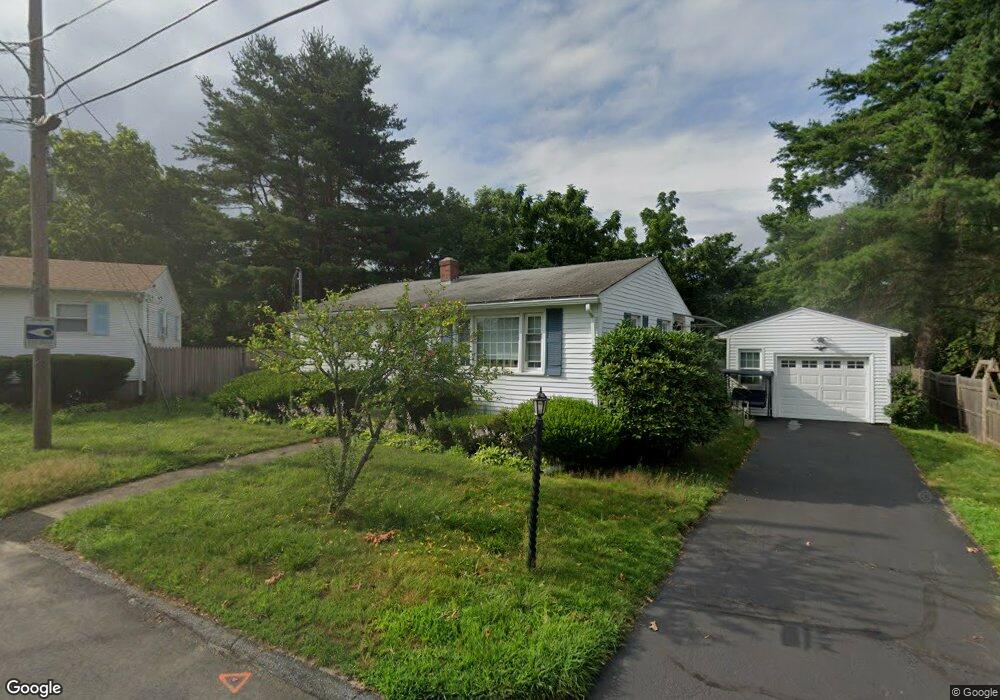
39 Fyffe Ave Cranston, RI 02920
Mayfield NeighborhoodEstimated Value: $347,000 - $396,988
2
Beds
1
Bath
792
Sq Ft
$465/Sq Ft
Est. Value
About This Home
This home is located at 39 Fyffe Ave, Cranston, RI 02920 and is currently estimated at $368,247, approximately $464 per square foot. 39 Fyffe Ave is a home located in Providence County with nearby schools including Garden City School, Western Hills Middle School, and Cranston High School West.
Ownership History
Date
Name
Owned For
Owner Type
Purchase Details
Closed on
Oct 4, 2023
Sold by
Villani Tracey A
Bought by
Villani Josephine E
Current Estimated Value
Purchase Details
Closed on
Mar 27, 2023
Sold by
Villani Josephine E
Bought by
Villani Tracey A
Create a Home Valuation Report for This Property
The Home Valuation Report is an in-depth analysis detailing your home's value as well as a comparison with similar homes in the area
Home Values in the Area
Average Home Value in this Area
Purchase History
| Date | Buyer | Sale Price | Title Company |
|---|---|---|---|
| Villani Josephine E | -- | None Available | |
| Villani Tracey A | -- | None Available |
Source: Public Records
Tax History
| Year | Tax Paid | Tax Assessment Tax Assessment Total Assessment is a certain percentage of the fair market value that is determined by local assessors to be the total taxable value of land and additions on the property. | Land | Improvement |
|---|---|---|---|---|
| 2025 | $4,251 | $306,300 | $110,100 | $196,200 |
| 2024 | $4,169 | $306,300 | $110,100 | $196,200 |
| 2023 | $3,929 | $207,900 | $72,500 | $135,400 |
| 2022 | $3,848 | $207,900 | $72,500 | $135,400 |
| 2021 | $3,742 | $207,900 | $72,500 | $135,400 |
| 2020 | $3,585 | $172,600 | $69,000 | $103,600 |
| 2019 | $3,585 | $172,600 | $69,000 | $103,600 |
| 2018 | $3,502 | $172,600 | $69,000 | $103,600 |
| 2017 | $3,333 | $145,300 | $62,100 | $83,200 |
| 2016 | $3,262 | $145,300 | $62,100 | $83,200 |
| 2015 | $3,262 | $145,300 | $62,100 | $83,200 |
| 2014 | $3,220 | $141,000 | $62,100 | $78,900 |
Source: Public Records
Map
Nearby Homes
- 10 East St Unit 316
- 20 Hilltop Dr
- 33 Rose Hill Dr
- 36 Bleachery Ct
- 14 W Natick Rd
- 14 Amanda St
- 20 Manilla Ave
- 115 Edman St
- 78 Wilbur Ave
- 1027 Providence St Unit 4B
- 123 Edman St
- 50 Briarwood Rd
- 82 Mountain Laurel Dr
- 157 Sweetbriar Dr
- 87 Lincoln Park Ave
- 993 Williamsburg Cir
- 52 Cottonwood Dr
- 892 Halifax Dr
- 122 Edaville Ct
- 69 Haverhill Ave
Your Personal Tour Guide
Ask me questions while you tour the home.