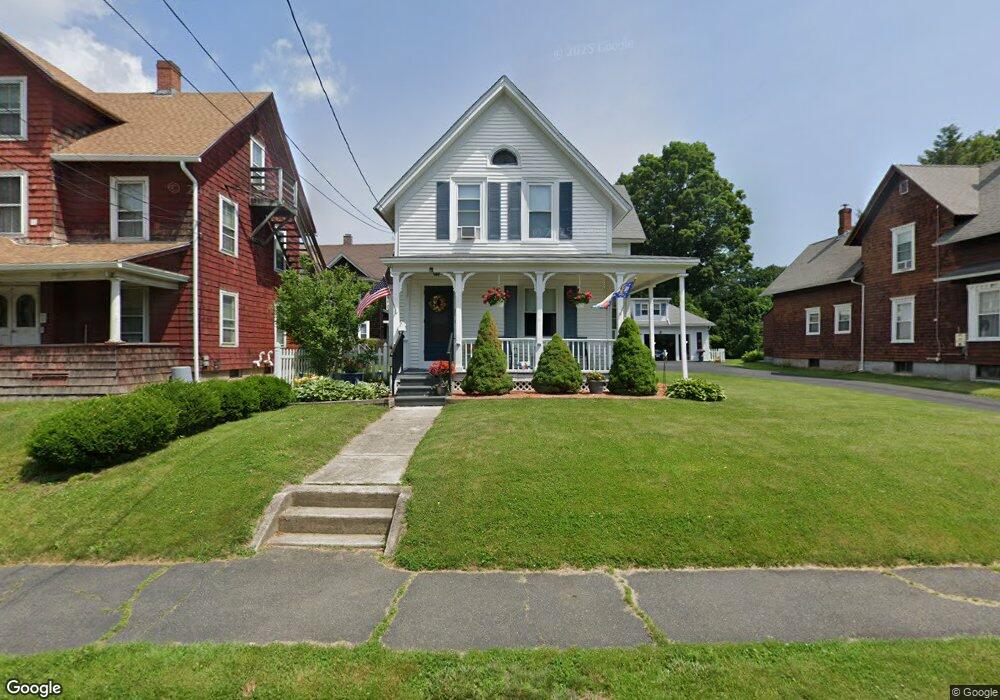
39 Garfield St Greenfield, MA 01301
Estimated Value: $308,000 - $378,000
4
Beds
1
Bath
1,609
Sq Ft
$214/Sq Ft
Est. Value
About This Home
This home is located at 39 Garfield St, Greenfield, MA 01301 and is currently estimated at $344,220, approximately $213 per square foot. 39 Garfield St is a home located in Franklin County with nearby schools including Holy Trinity School and Cornerstone Christian School.
Ownership History
Date
Name
Owned For
Owner Type
Purchase Details
Closed on
Jul 13, 2009
Sold by
Telega Theodore
Bought by
Kaczenski John J and Kaczenski Joann E
Current Estimated Value
Purchase Details
Closed on
Aug 31, 1988
Sold by
Harris Ralph Jr Est
Bought by
Telega Theodore
Home Financials for this Owner
Home Financials are based on the most recent Mortgage that was taken out on this home.
Original Mortgage
$73,600
Interest Rate
10.38%
Mortgage Type
Purchase Money Mortgage
Create a Home Valuation Report for This Property
The Home Valuation Report is an in-depth analysis detailing your home's value as well as a comparison with similar homes in the area
Home Values in the Area
Average Home Value in this Area
Purchase History
| Date | Buyer | Sale Price | Title Company |
|---|---|---|---|
| Kaczenski John J | -- | -- | |
| Kaczenski John J | -- | -- | |
| Telega Theodore | $92,000 | -- |
Source: Public Records
Mortgage History
| Date | Status | Borrower | Loan Amount |
|---|---|---|---|
| Previous Owner | Telega Theodore | $67,400 | |
| Previous Owner | Telega Theodore | $73,600 |
Source: Public Records
Tax History Compared to Growth
Tax History
| Year | Tax Paid | Tax Assessment Tax Assessment Total Assessment is a certain percentage of the fair market value that is determined by local assessors to be the total taxable value of land and additions on the property. | Land | Improvement |
|---|---|---|---|---|
| 2025 | $6,281 | $321,100 | $65,600 | $255,500 |
| 2024 | $6,250 | $306,500 | $52,600 | $253,900 |
| 2023 | $5,596 | $284,800 | $52,600 | $232,200 |
| 2022 | $5,143 | $230,400 | $47,700 | $182,700 |
| 2021 | $4,953 | $213,300 | $47,300 | $166,000 |
| 2020 | $4,666 | $203,500 | $43,100 | $160,400 |
| 2019 | $4,423 | $197,800 | $37,400 | $160,400 |
| 2018 | $4,356 | $194,200 | $36,700 | $157,500 |
| 2017 | $4,220 | $194,200 | $36,700 | $157,500 |
| 2016 | $4,185 | $191,900 | $35,300 | $156,600 |
| 2015 | $4,158 | $184,700 | $39,500 | $145,200 |
| 2014 | $3,796 | $184,900 | $39,500 | $145,400 |
Source: Public Records
Map
Nearby Homes