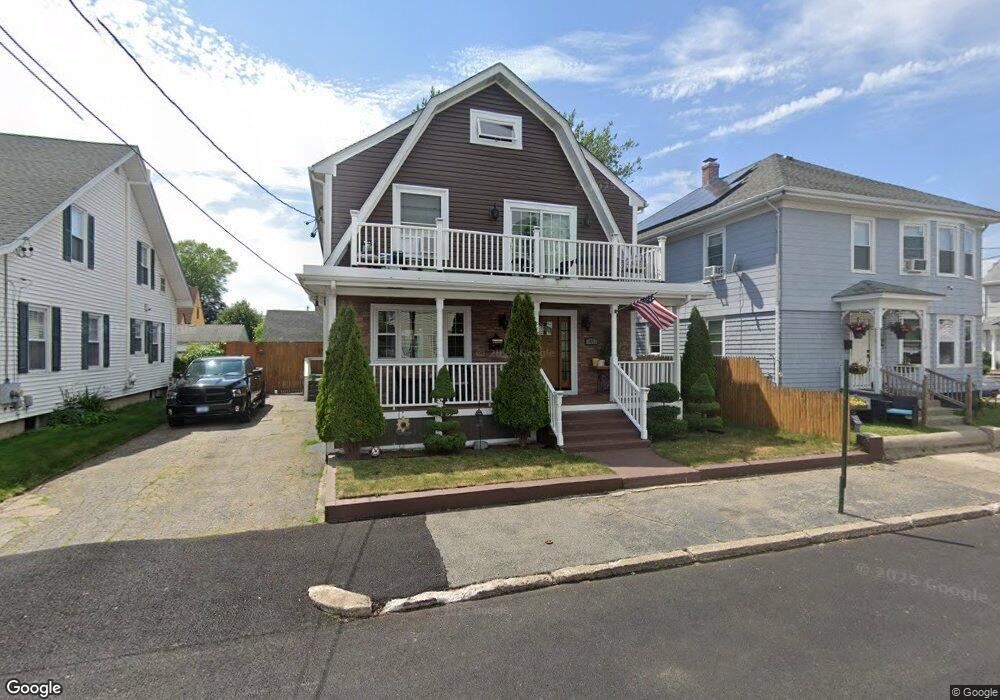
39 Hatfield St Pawtucket, RI 02861
Darlington NeighborhoodEstimated Value: $471,183 - $546,000
4
Beds
2
Baths
2,240
Sq Ft
$231/Sq Ft
Est. Value
About This Home
This home is located at 39 Hatfield St, Pawtucket, RI 02861 and is currently estimated at $518,296, approximately $231 per square foot. 39 Hatfield St is a home located in Providence County with nearby schools including St Cecilia School and Saint Teresa Catholic Elementary School.
Ownership History
Date
Name
Owned For
Owner Type
Purchase Details
Closed on
Oct 8, 2010
Sold by
Cityside Mgmt
Bought by
Sabatini David J
Current Estimated Value
Home Financials for this Owner
Home Financials are based on the most recent Mortgage that was taken out on this home.
Original Mortgage
$146,264
Outstanding Balance
$95,860
Interest Rate
4.37%
Mortgage Type
Purchase Money Mortgage
Estimated Equity
$422,436
Purchase Details
Closed on
May 6, 2010
Sold by
Ri Housing Dev Corp
Bought by
Department Of Housing & Urban Dev
Purchase Details
Closed on
Apr 5, 2010
Sold by
Viveiros Cynthia
Bought by
Rhode Island Hsng
Create a Home Valuation Report for This Property
The Home Valuation Report is an in-depth analysis detailing your home's value as well as a comparison with similar homes in the area
Home Values in the Area
Average Home Value in this Area
Purchase History
| Date | Buyer | Sale Price | Title Company |
|---|---|---|---|
| Sabatini David J | $114,000 | -- | |
| Department Of Housing & Urban Dev | -- | -- | |
| Rhode Island Hsng | $157,630 | -- |
Source: Public Records
Mortgage History
| Date | Status | Borrower | Loan Amount |
|---|---|---|---|
| Open | Rhode Island Hsng | $146,264 | |
| Previous Owner | Rhode Island Hsng | $50,000 | |
| Previous Owner | Rhode Island Hsng | $50,000 |
Source: Public Records
Tax History Compared to Growth
Tax History
| Year | Tax Paid | Tax Assessment Tax Assessment Total Assessment is a certain percentage of the fair market value that is determined by local assessors to be the total taxable value of land and additions on the property. | Land | Improvement |
|---|---|---|---|---|
| 2025 | $5,981 | $454,800 | $143,400 | $311,400 |
| 2024 | $5,612 | $454,800 | $143,400 | $311,400 |
| 2023 | $5,004 | $295,400 | $75,700 | $219,700 |
| 2022 | $4,898 | $295,400 | $75,700 | $219,700 |
| 2021 | $4,898 | $295,400 | $75,700 | $219,700 |
| 2020 | $3,988 | $190,900 | $63,100 | $127,800 |
| 2019 | $3,988 | $190,900 | $63,100 | $127,800 |
| 2018 | $3,843 | $190,900 | $63,100 | $127,800 |
| 2017 | $3,401 | $149,700 | $48,400 | $101,300 |
| 2016 | $3,277 | $149,700 | $48,400 | $101,300 |
| 2015 | $3,277 | $149,700 | $48,400 | $101,300 |
| 2014 | $3,247 | $140,800 | $48,400 | $92,400 |
Source: Public Records
Map
Nearby Homes