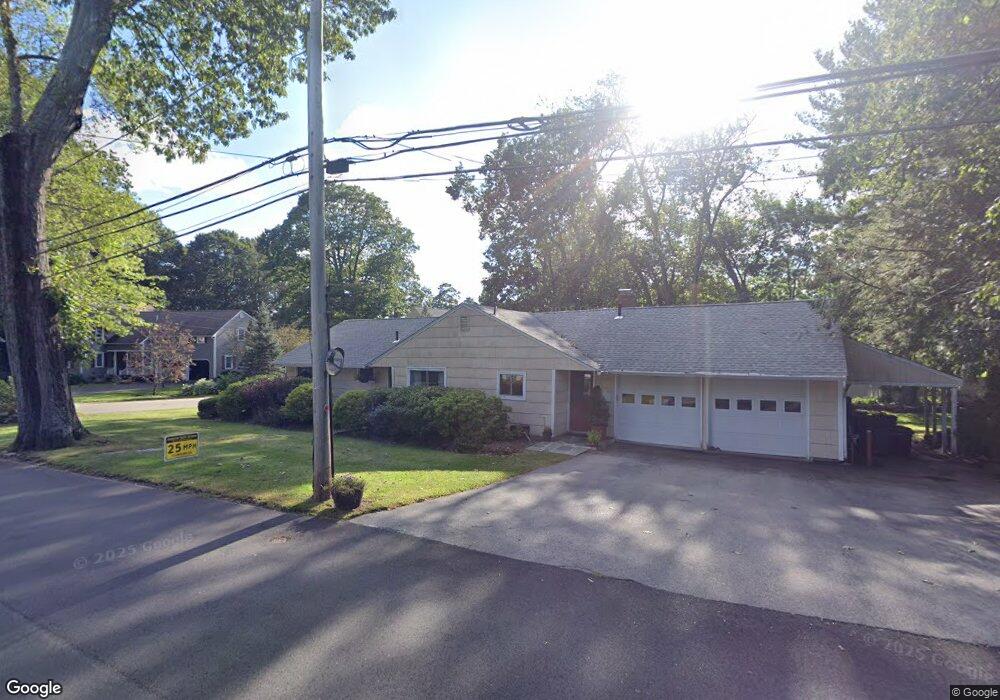
39 Hidden Rd Andover, MA 01810
Southern Andover NeighborhoodEstimated Value: $768,000 - $875,654
3
Beds
2
Baths
1,266
Sq Ft
$656/Sq Ft
Est. Value
About This Home
This home is located at 39 Hidden Rd, Andover, MA 01810 and is currently estimated at $830,414, approximately $655 per square foot. 39 Hidden Rd is a home located in Essex County with nearby schools including South Elementary School, Doherty Middle School, and Andover High School.
Ownership History
Date
Name
Owned For
Owner Type
Purchase Details
Closed on
Mar 2, 2007
Sold by
Baldwin John
Bought by
Hsu Elizabeth K
Current Estimated Value
Home Financials for this Owner
Home Financials are based on the most recent Mortgage that was taken out on this home.
Original Mortgage
$117,000
Outstanding Balance
$70,857
Interest Rate
6.27%
Mortgage Type
Purchase Money Mortgage
Estimated Equity
$759,557
Purchase Details
Closed on
Mar 31, 2005
Sold by
Bakshi 1999 Rt and Bakshi Joyce L
Bought by
Baldwin John
Home Financials for this Owner
Home Financials are based on the most recent Mortgage that was taken out on this home.
Original Mortgage
$332,000
Interest Rate
5.61%
Mortgage Type
Purchase Money Mortgage
Create a Home Valuation Report for This Property
The Home Valuation Report is an in-depth analysis detailing your home's value as well as a comparison with similar homes in the area
Home Values in the Area
Average Home Value in this Area
Purchase History
| Date | Buyer | Sale Price | Title Company |
|---|---|---|---|
| Hsu Elizabeth K | $417,000 | -- | |
| Baldwin John | $415,000 | -- |
Source: Public Records
Mortgage History
| Date | Status | Borrower | Loan Amount |
|---|---|---|---|
| Open | Hsu Elizabeth K | $117,000 | |
| Previous Owner | Baldwin John | $332,000 |
Source: Public Records
Tax History
| Year | Tax Paid | Tax Assessment Tax Assessment Total Assessment is a certain percentage of the fair market value that is determined by local assessors to be the total taxable value of land and additions on the property. | Land | Improvement |
|---|---|---|---|---|
| 2024 | $8,981 | $697,300 | $504,400 | $192,900 |
| 2023 | $8,568 | $627,200 | $454,300 | $172,900 |
| 2022 | $7,963 | $545,400 | $395,000 | $150,400 |
| 2021 | $7,614 | $498,000 | $359,000 | $139,000 |
| 2020 | $7,301 | $486,400 | $350,200 | $136,200 |
| 2019 | $7,090 | $464,300 | $340,100 | $124,200 |
| 2018 | $6,914 | $442,100 | $327,000 | $115,100 |
| 2017 | $6,597 | $434,600 | $320,400 | $114,200 |
| 2016 | $6,441 | $434,600 | $320,400 | $114,200 |
| 2015 | $6,232 | $416,300 | $308,000 | $108,300 |
Source: Public Records
Map
Nearby Homes
- 16 Porter Rd
- 4 Hammond Way
- 31 Porter Rd
- 57 Salem St
- 49 Salem St
- 52 Salem St
- 56 Sunset Rock Rd
- 344 S Main St
- 3 West Hollow
- 133B Salem
- 154 Main St
- 23 Belknap Dr
- 3 Torr St
- 11 Wyncrest Cir
- 3 Regency Ridge
- 105 Central St
- 100.5 Main St Unit Q
- 96 N Main St Unit 3
- 33 Chestnut St Unit 2
- 81 Chestnut St Unit 81
Your Personal Tour Guide
Ask me questions while you tour the home.