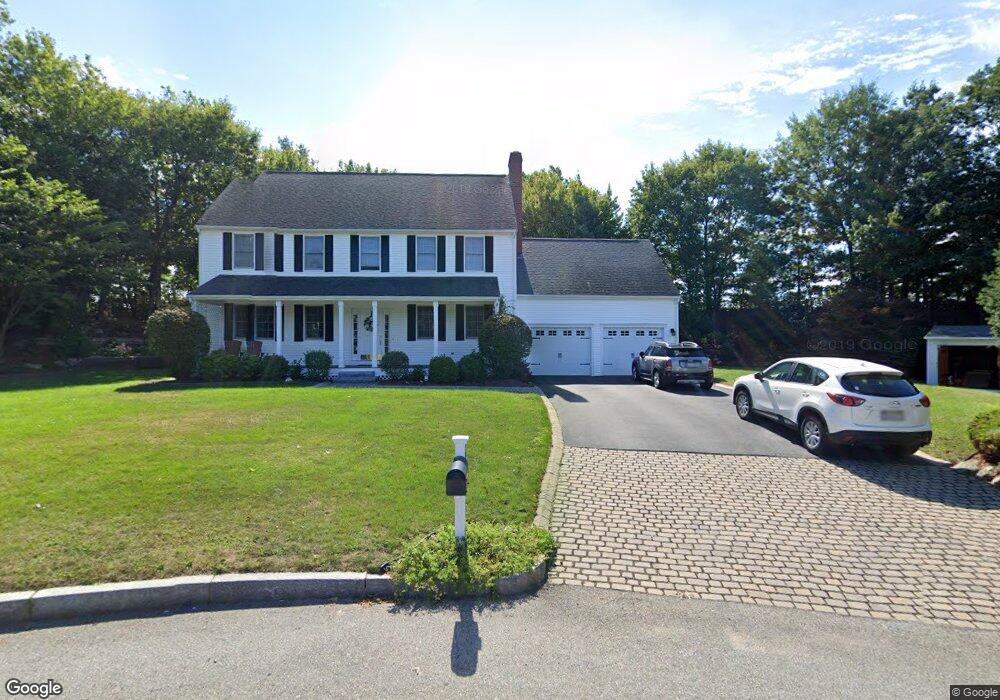
39 Jasons Path Walpole, MA 02081
Estimated Value: $932,047 - $1,032,000
4
Beds
3
Baths
2,240
Sq Ft
$439/Sq Ft
Est. Value
About This Home
This home is located at 39 Jasons Path, Walpole, MA 02081 and is currently estimated at $983,262, approximately $438 per square foot. 39 Jasons Path is a home located in Norfolk County with nearby schools including Boyden School, Eleanor N. Johnson Middle School, and Walpole High School.
Ownership History
Date
Name
Owned For
Owner Type
Purchase Details
Closed on
May 16, 2017
Sold by
Craig Gordon M and Craig Carole A
Bought by
Craig Ft
Current Estimated Value
Purchase Details
Closed on
Jul 30, 1999
Sold by
Hasenjaeger Erich
Bought by
Craig Gordon M and Craig Carole A
Create a Home Valuation Report for This Property
The Home Valuation Report is an in-depth analysis detailing your home's value as well as a comparison with similar homes in the area
Home Values in the Area
Average Home Value in this Area
Purchase History
| Date | Buyer | Sale Price | Title Company |
|---|---|---|---|
| Craig Ft | -- | -- | |
| Craig Gordon M | $329,900 | -- |
Source: Public Records
Mortgage History
| Date | Status | Borrower | Loan Amount |
|---|---|---|---|
| Previous Owner | Craig Gordon M | $364,500 | |
| Previous Owner | Craig Gordon M | $375,000 | |
| Previous Owner | Craig Gordon M | $375,000 |
Source: Public Records
Tax History
| Year | Tax Paid | Tax Assessment Tax Assessment Total Assessment is a certain percentage of the fair market value that is determined by local assessors to be the total taxable value of land and additions on the property. | Land | Improvement |
|---|---|---|---|---|
| 2025 | $10,544 | $821,800 | $354,300 | $467,500 |
| 2024 | $10,201 | $771,600 | $340,600 | $431,000 |
| 2023 | $9,758 | $702,500 | $296,200 | $406,300 |
| 2022 | $9,139 | $632,000 | $274,300 | $357,700 |
| 2021 | $8,981 | $605,200 | $258,700 | $346,500 |
| 2020 | $8,699 | $580,300 | $244,100 | $336,200 |
| 2019 | $8,385 | $555,300 | $234,700 | $320,600 |
| 2018 | $8,130 | $532,400 | $226,600 | $305,800 |
| 2017 | $7,901 | $515,400 | $217,900 | $297,500 |
| 2016 | $7,674 | $493,200 | $209,600 | $283,600 |
| 2015 | $7,514 | $478,600 | $208,000 | $270,600 |
| 2014 | $7,228 | $458,600 | $208,000 | $250,600 |
Source: Public Records
Map
Nearby Homes
- 38 Irving Dr
- 1935 Washington Street Extension
- 2 Boette Ln
- 1549 Washington St Unit A
- 3 Stone Hill Terrace
- 5 Jackson Dr
- 16R Eldor Dr
- 120 Beach St
- 260 Summer St
- 375 Winter St
- 9 Pearl St
- 180 Old Post Rd Unit 202
- 180 Old Post Rd Unit 206
- 180 Old Post Rd Unit 308
- 180 Old Post Rd Unit 201
- 180 Old Post Rd Unit 405
- 180 Old Post Rd Unit 207
- 6 Eleanor Rd
- 1 Roseland St Unit B-14
- 0 U S Route 1
Your Personal Tour Guide
Ask me questions while you tour the home.