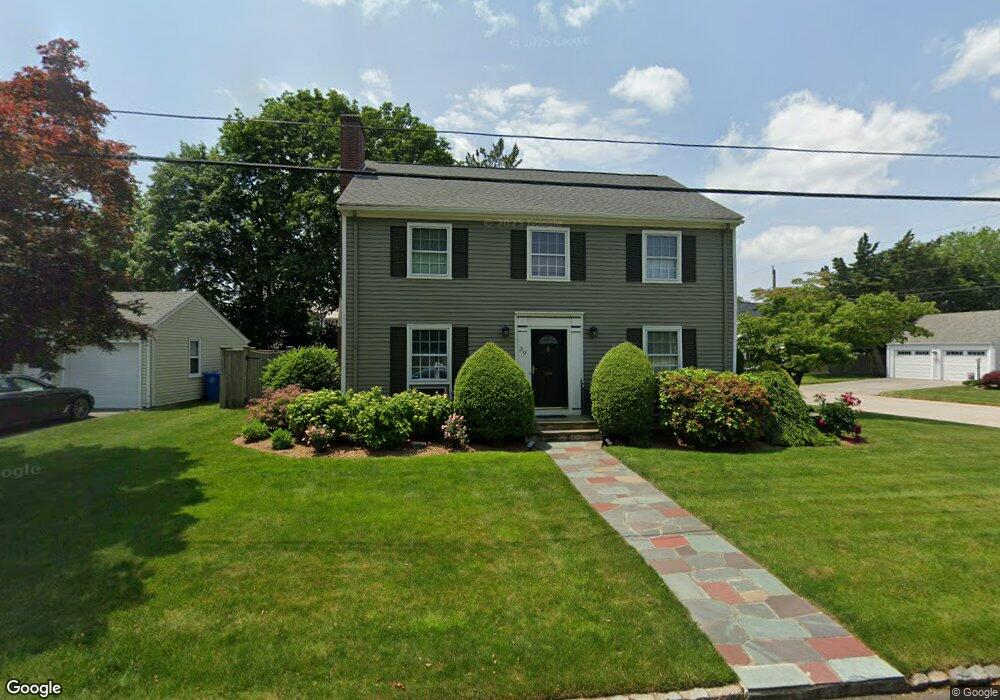
39 Kenyon Rd Cranston, RI 02910
Eden Park NeighborhoodEstimated Value: $506,000 - $562,000
3
Beds
3
Baths
2,040
Sq Ft
$259/Sq Ft
Est. Value
About This Home
This home is located at 39 Kenyon Rd, Cranston, RI 02910 and is currently estimated at $527,821, approximately $258 per square foot. 39 Kenyon Rd is a home located in Providence County with nearby schools including Park View Middle School, Cranston High School East, and Cadence Academy Preschool - Cranston.
Ownership History
Date
Name
Owned For
Owner Type
Purchase Details
Closed on
Aug 30, 2010
Sold by
Mignahelli Anthony R
Bought by
Finucane Lisa M
Current Estimated Value
Home Financials for this Owner
Home Financials are based on the most recent Mortgage that was taken out on this home.
Original Mortgage
$172,000
Outstanding Balance
$113,881
Interest Rate
4.57%
Mortgage Type
Purchase Money Mortgage
Estimated Equity
$413,940
Purchase Details
Closed on
Nov 30, 1995
Sold by
Zimmerman Stephen J and Zimmerman Susan
Bought by
Place Dorothy C
Purchase Details
Closed on
Aug 31, 1989
Sold by
Hahn Stephen J
Bought by
Zimmerman Stephen J
Home Financials for this Owner
Home Financials are based on the most recent Mortgage that was taken out on this home.
Original Mortgage
$157,500
Interest Rate
9.7%
Create a Home Valuation Report for This Property
The Home Valuation Report is an in-depth analysis detailing your home's value as well as a comparison with similar homes in the area
Home Values in the Area
Average Home Value in this Area
Purchase History
| Date | Buyer | Sale Price | Title Company |
|---|---|---|---|
| Finucane Lisa M | $215,000 | -- | |
| Place Dorothy C | $165,000 | -- | |
| Zimmerman Stephen J | $175,000 | -- |
Source: Public Records
Mortgage History
| Date | Status | Borrower | Loan Amount |
|---|---|---|---|
| Open | Zimmerman Stephen J | $172,000 | |
| Previous Owner | Zimmerman Stephen J | $157,500 |
Source: Public Records
Tax History
| Year | Tax Paid | Tax Assessment Tax Assessment Total Assessment is a certain percentage of the fair market value that is determined by local assessors to be the total taxable value of land and additions on the property. | Land | Improvement |
|---|---|---|---|---|
| 2025 | $6,658 | $479,700 | $109,200 | $370,500 |
| 2024 | $6,529 | $479,700 | $109,200 | $370,500 |
| 2023 | $6,214 | $328,800 | $71,900 | $256,900 |
| 2022 | $6,086 | $328,800 | $71,900 | $256,900 |
| 2021 | $5,918 | $328,800 | $71,900 | $256,900 |
| 2020 | $5,965 | $287,200 | $68,400 | $218,800 |
| 2019 | $5,965 | $287,200 | $68,400 | $218,800 |
| 2018 | $5,827 | $287,200 | $68,400 | $218,800 |
| 2017 | $5,620 | $245,000 | $61,600 | $183,400 |
| 2016 | $5,500 | $245,000 | $61,600 | $183,400 |
| 2015 | $5,500 | $245,000 | $61,600 | $183,400 |
| 2014 | $4,988 | $218,400 | $61,600 | $156,800 |
Source: Public Records
Map
Nearby Homes
- 10 Dale Ave
- 33 Hemlock Ave
- 167 Forest Ave
- 10 Woburn St
- 80 Colonial Ave
- 103 Harper Ave
- 64 Holburn Ave
- 54 Holburn Ave
- 144 Laurens St
- 181 Grace St
- 150 Riverside Ave
- 124 Clarence St
- 859 Pontiac Ave
- 25 Sharon St Unit 2
- 363 Pontiac Ave
- 152 Woodbine St
- 84 Intervale Rd
- 75 Sharon St
- 90 Garden St
- 288 Pontiac Ave
Your Personal Tour Guide
Ask me questions while you tour the home.