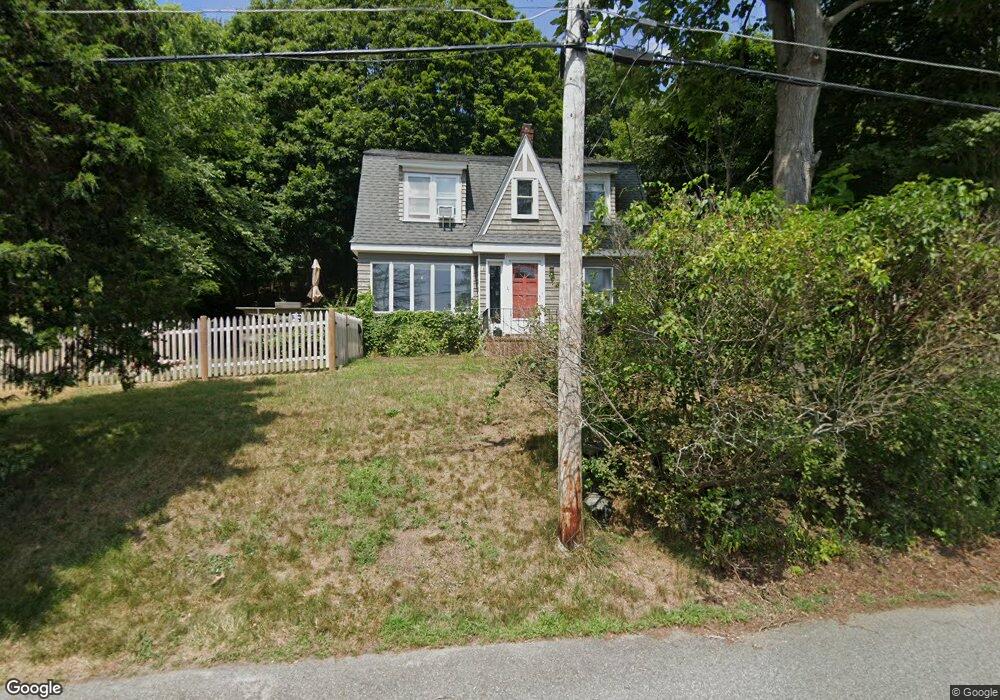
39 Lake St Middleton, MA 01949
Estimated Value: $905,000 - $1,053,000
3
Beds
3
Baths
3,296
Sq Ft
$295/Sq Ft
Est. Value
About This Home
This home is located at 39 Lake St, Middleton, MA 01949 and is currently estimated at $972,314, approximately $294 per square foot. 39 Lake St is a home located in Essex County with nearby schools including Howe-Manning Elementary School, Fuller Meadow Elementary School, and Masconomet Regional Middle School.
Ownership History
Date
Name
Owned For
Owner Type
Purchase Details
Closed on
Mar 25, 2011
Sold by
Stewart Karen A
Bought by
Stewart Karen A and Chase Dennis M
Current Estimated Value
Home Financials for this Owner
Home Financials are based on the most recent Mortgage that was taken out on this home.
Original Mortgage
$400,000
Interest Rate
5.07%
Mortgage Type
Purchase Money Mortgage
Purchase Details
Closed on
Oct 30, 2009
Sold by
Stewart James W Est and Stewart
Bought by
Stewart Karen A
Create a Home Valuation Report for This Property
The Home Valuation Report is an in-depth analysis detailing your home's value as well as a comparison with similar homes in the area
Home Values in the Area
Average Home Value in this Area
Purchase History
| Date | Buyer | Sale Price | Title Company |
|---|---|---|---|
| Stewart Karen A | -- | -- | |
| Stewart Karen A | -- | -- | |
| Stewart Karen A | -- | -- | |
| Stewart Karen A | -- | -- |
Source: Public Records
Mortgage History
| Date | Status | Borrower | Loan Amount |
|---|---|---|---|
| Open | Stewart Karen A | $393,000 | |
| Closed | Stewart Karen A | $400,000 |
Source: Public Records
Tax History Compared to Growth
Tax History
| Year | Tax Paid | Tax Assessment Tax Assessment Total Assessment is a certain percentage of the fair market value that is determined by local assessors to be the total taxable value of land and additions on the property. | Land | Improvement |
|---|---|---|---|---|
| 2025 | $9,507 | $799,600 | $336,900 | $462,700 |
| 2024 | $8,495 | $720,500 | $313,000 | $407,500 |
| 2023 | $8,825 | $685,700 | $313,000 | $372,700 |
| 2022 | $7,485 | $564,900 | $248,100 | $316,800 |
| 2021 | $7,200 | $524,800 | $219,800 | $305,000 |
| 2020 | $7,408 | $543,900 | $219,800 | $324,100 |
| 2019 | $7,620 | $556,600 | $219,800 | $336,800 |
| 2018 | $7,319 | $524,300 | $197,600 | $326,700 |
| 2017 | $7,073 | $507,000 | $178,600 | $328,400 |
| 2016 | $7,513 | $540,900 | $195,700 | $345,200 |
| 2015 | $6,806 | $493,900 | $165,900 | $328,000 |
Source: Public Records
Map
Nearby Homes
- 53 N Main St Unit 53
- 39 Central St
- 49 Maple St Unit B
- 10 Callaway Dr Unit 10
- 89 Forest St
- 77 Essex St
- 19 James Ave
- 8 James Ave
- 5 Old Haswell Park Rd
- 2 Tyler Ln
- 123 Forest St
- 1 Mills Point Unit 1
- 196-200 B1 N Main St
- 28 Niblick Way
- 30 Maytum Way Unit 30
- 62 Cabral Dr
- 34 Kenney Rd
- 30 Donovans Way
- 3 Useadoor St
- 10 Dogwood Ln