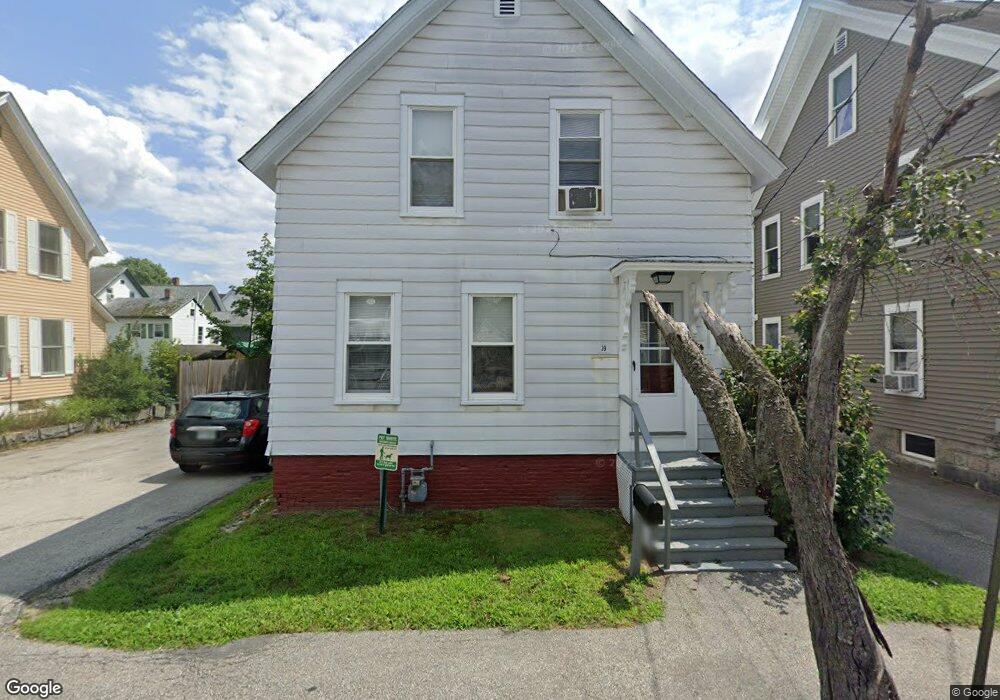
39 Laurel St Concord, NH 03301
South End NeighborhoodEstimated Value: $377,188 - $407,000
3
Beds
1
Bath
1,322
Sq Ft
$301/Sq Ft
Est. Value
About This Home
This home is located at 39 Laurel St, Concord, NH 03301 and is currently estimated at $397,297, approximately $300 per square foot. 39 Laurel St is a home located in Merrimack County with nearby schools including Christa McAuliffe School, Rundlett Middle School, and Concord High School.
Ownership History
Date
Name
Owned For
Owner Type
Purchase Details
Closed on
Feb 16, 2007
Sold by
Macdonald Douglas D and Macdonald Amy M
Bought by
Tarbell Eaton W
Current Estimated Value
Home Financials for this Owner
Home Financials are based on the most recent Mortgage that was taken out on this home.
Original Mortgage
$160,000
Outstanding Balance
$96,259
Interest Rate
6.24%
Mortgage Type
Purchase Money Mortgage
Estimated Equity
$301,038
Purchase Details
Closed on
Oct 31, 2002
Sold by
Milligan Michael P and Milligan Joyce S
Bought by
Macdonald Douglas D and Macdonald Amy M
Home Financials for this Owner
Home Financials are based on the most recent Mortgage that was taken out on this home.
Original Mortgage
$126,000
Interest Rate
6.09%
Mortgage Type
Purchase Money Mortgage
Create a Home Valuation Report for This Property
The Home Valuation Report is an in-depth analysis detailing your home's value as well as a comparison with similar homes in the area
Home Values in the Area
Average Home Value in this Area
Purchase History
| Date | Buyer | Sale Price | Title Company |
|---|---|---|---|
| Tarbell Eaton W | $200,000 | -- | |
| Macdonald Douglas D | $140,000 | -- |
Source: Public Records
Mortgage History
| Date | Status | Borrower | Loan Amount |
|---|---|---|---|
| Open | Macdonald Douglas D | $160,000 | |
| Previous Owner | Macdonald Douglas D | $126,000 |
Source: Public Records
Tax History Compared to Growth
Tax History
| Year | Tax Paid | Tax Assessment Tax Assessment Total Assessment is a certain percentage of the fair market value that is determined by local assessors to be the total taxable value of land and additions on the property. | Land | Improvement |
|---|---|---|---|---|
| 2024 | $6,028 | $217,700 | $89,800 | $127,900 |
| 2023 | $5,847 | $217,700 | $89,800 | $127,900 |
| 2022 | $5,636 | $217,700 | $89,800 | $127,900 |
| 2021 | $5,501 | $219,000 | $89,800 | $129,200 |
| 2020 | $4,932 | $184,300 | $71,600 | $112,700 |
| 2019 | $4,523 | $162,800 | $66,500 | $96,300 |
| 2018 | $4,484 | $159,100 | $66,500 | $92,600 |
| 2017 | $4,301 | $152,300 | $66,500 | $85,800 |
| 2016 | $4,115 | $148,700 | $66,500 | $82,200 |
| 2015 | $3,860 | $142,300 | $65,200 | $77,100 |
| 2014 | $3,815 | $142,300 | $65,200 | $77,100 |
| 2013 | -- | $141,500 | $65,200 | $76,300 |
| 2012 | -- | $140,900 | $65,200 | $75,700 |
Source: Public Records
Map
Nearby Homes
- 24 Pierce St
- 47 South St
- 26 South St
- 0 Spruce St Unit 88
- 33 Spruce St
- 4 N Spring St
- 105 S Main St
- 1 Matthew St Unit 6
- 69 Centre St
- 0 South St Unit 4969509
- 5 Broad Ave
- 1 Kensington Rd
- 128 Liberty St
- 11 Washington St
- 55 Tremont St
- 30 Jackson St
- 24 Hazel Dr
- 7 Highridge Trail
- 22 Longmeadow Dr
- 22 Fairfield Dr