A
Landlord's Agent in 2024
Alvin Tsang
Thread Real Estate, LLC
(617) 529-8769
5 Total Sales

Estimated Value: $637,000 - $935,000
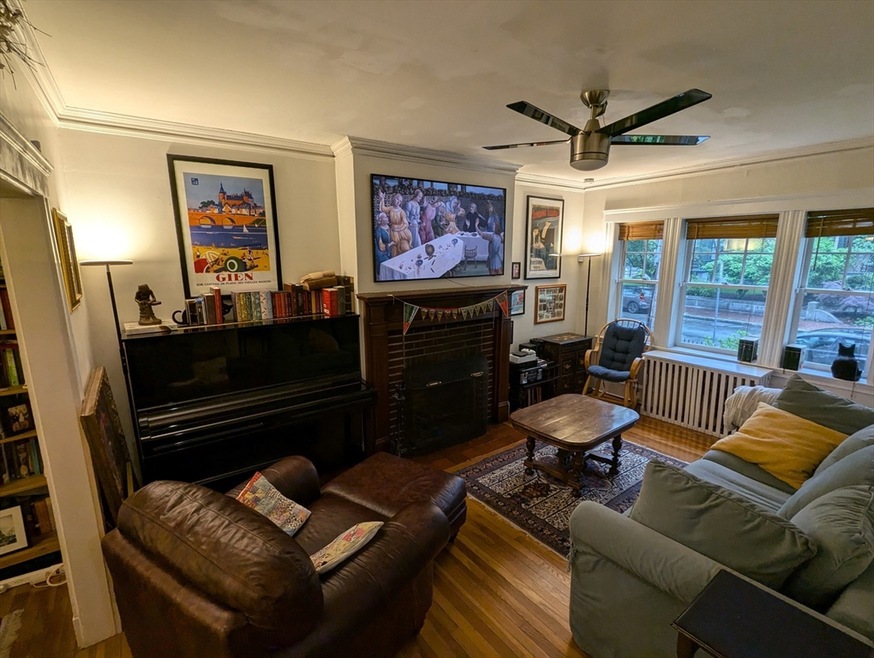
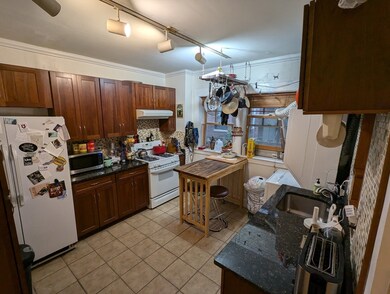
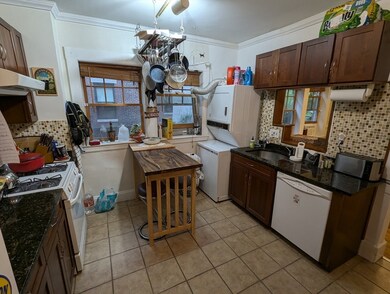
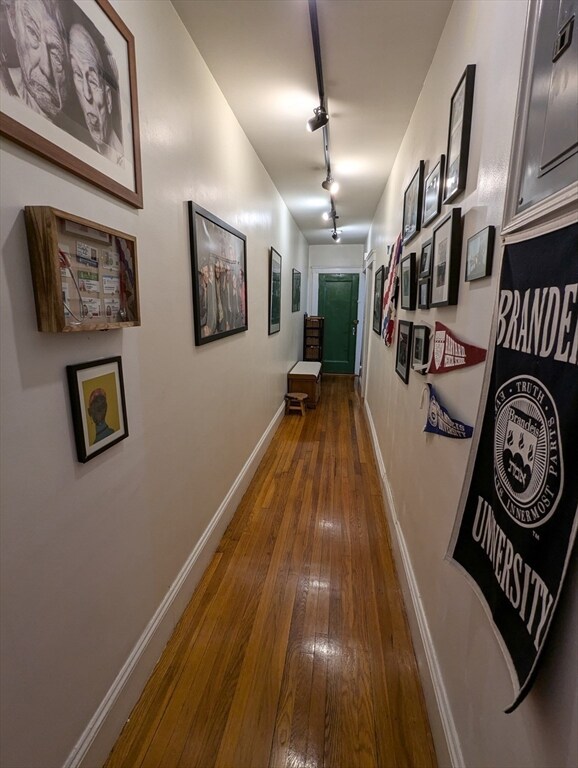
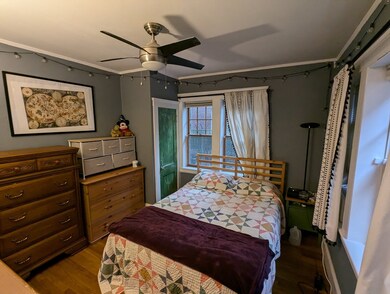
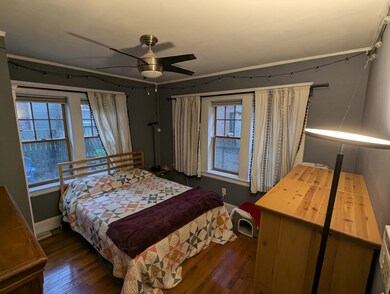
Premium Central Square 2BR/1.5BA available for September 1st. Features fully-applianced kitchen with granite counters and cherrywood cabinets, hardwood floors, high ceilings, newer thermal windows, chrome and brushed nickel bathroom fixtures, and in-unit washer and dryer. Heat and hot water included in rent. Spacious bedrooms each with their own closet. Professionally landscaped common space with small private backyard and patio. Short distance to Central Square Station on Red Line and easy commute to both Harvard and MIT. Virtual tour link available upon request.
| Date | Buyer | Sale Price | Title Company |
|---|---|---|---|
| Tsang Alvin | $287,000 | -- | |
| 39 Lee 2 Rt | $27,568 | -- | |
| Central Coop Bk | $43,000 | -- |
| Date | Status | Borrower | Loan Amount |
|---|---|---|---|
| Open | Central Coop Bk | $235,000 | |
| Closed | Central Coop Bk | $124,000 | |
| Previous Owner | Central Coop Bk | $445,000 |
| Date | Event | Price | List to Sale | Price per Sq Ft |
|---|---|---|---|---|
| 07/10/2024 07/10/24 | Rented | $3,600 | 0.0% | -- |
| 06/30/2024 06/30/24 | Under Contract | -- | -- | -- |
| 06/25/2024 06/25/24 | For Rent | $3,600 | +28.6% | -- |
| 08/17/2020 08/17/20 | Rented | $2,800 | 0.0% | -- |
| 08/15/2020 08/15/20 | Under Contract | -- | -- | -- |
| 08/02/2020 08/02/20 | For Rent | $2,800 | -- | -- |
| Year | Tax Paid | Tax Assessment Tax Assessment Total Assessment is a certain percentage of the fair market value that is determined by local assessors to be the total taxable value of land and additions on the property. | Land | Improvement |
|---|---|---|---|---|
| 2025 | $4,350 | $685,100 | $0 | $685,100 |
| 2024 | $4,027 | $680,200 | $0 | $680,200 |
| 2023 | $3,863 | $659,200 | $0 | $659,200 |
| 2022 | $3,847 | $649,900 | $0 | $649,900 |
| 2021 | $3,766 | $643,700 | $0 | $643,700 |
| 2020 | $3,609 | $627,700 | $0 | $627,700 |
| 2019 | $3,455 | $581,600 | $0 | $581,600 |
| 2018 | $3,353 | $533,000 | $0 | $533,000 |
| 2017 | $3,237 | $498,700 | $0 | $498,700 |
| 2016 | $3,147 | $450,200 | $0 | $450,200 |
| 2015 | $3,112 | $397,900 | $0 | $397,900 |
| 2014 | $2,973 | $354,800 | $0 | $354,800 |
A
Landlord's Agent in 2024
Alvin Tsang
Thread Real Estate, LLC
(617) 529-8769
5 Total Sales
Source: MLS Property Information Network (MLS PIN)
MLS Number: 73256811
APN: CAMB-000117-000000-000101-000002
Disclaimer: Certain information contained herein is derived from information provided by parties other than Homes.com. All information provided is deemed reliable, but is not guaranteed to be accurate and should be independently verified.
![]() The property listing data and information, or the Images, set forth herein were provided to MLS Property Information Network, Inc. from third party sources, including sellers, lessors and public records, and were compiled by MLS Property Information Network, Inc. The property listing data and information, and the Images, are for the personal, non-commercial use of consumers having a good faith interest in purchasing or leasing listed properties of the type displayed to them and may not be used for any purpose other than to identify prospective properties which such consumers may have a good faith interest in purchasing or leasing. MLS Property Information Network, Inc. and its subscribers disclaim any and all representations and warranties as to the accuracy of the property listing data and information, or as to the accuracy of any of the Images, set forth herein.
The property listing data and information, or the Images, set forth herein were provided to MLS Property Information Network, Inc. from third party sources, including sellers, lessors and public records, and were compiled by MLS Property Information Network, Inc. The property listing data and information, and the Images, are for the personal, non-commercial use of consumers having a good faith interest in purchasing or leasing listed properties of the type displayed to them and may not be used for any purpose other than to identify prospective properties which such consumers may have a good faith interest in purchasing or leasing. MLS Property Information Network, Inc. and its subscribers disclaim any and all representations and warranties as to the accuracy of the property listing data and information, or as to the accuracy of any of the Images, set forth herein.
