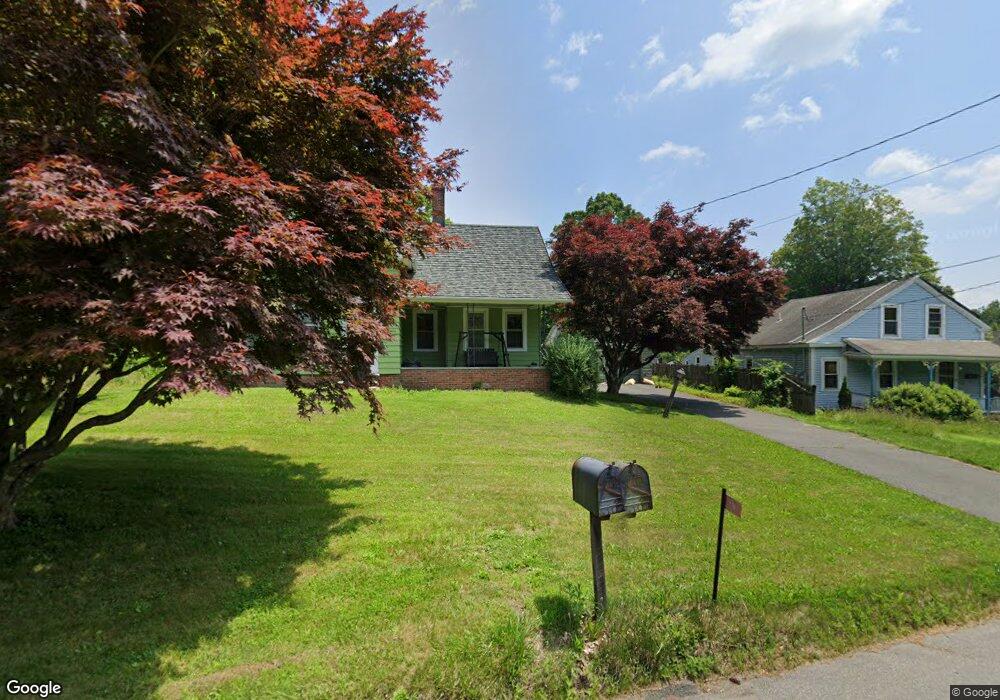
39 Leyden Rd Unit 1 Greenfield, MA 01301
Estimated Value: $306,000 - $348,681
2
Beds
2
Baths
1,504
Sq Ft
$217/Sq Ft
Est. Value
About This Home
This home is located at 39 Leyden Rd Unit 1, Greenfield, MA 01301 and is currently estimated at $325,670, approximately $216 per square foot. 39 Leyden Rd Unit 1 is a home located in Franklin County with nearby schools including Four Rivers Charter Public School and Cornerstone Christian School.
Ownership History
Date
Name
Owned For
Owner Type
Purchase Details
Closed on
Sep 25, 2019
Sold by
Cross Robert and Cross Cindy J
Bought by
Wrisley Nicole
Current Estimated Value
Home Financials for this Owner
Home Financials are based on the most recent Mortgage that was taken out on this home.
Original Mortgage
$160,000
Outstanding Balance
$139,880
Interest Rate
3.4%
Mortgage Type
New Conventional
Estimated Equity
$185,790
Purchase Details
Closed on
Apr 30, 2007
Sold by
Zimmerman Georgene S and Zimmerman Lee F
Bought by
Cross Cindy and Cross Robert
Home Financials for this Owner
Home Financials are based on the most recent Mortgage that was taken out on this home.
Original Mortgage
$220,400
Interest Rate
6.18%
Mortgage Type
Purchase Money Mortgage
Purchase Details
Closed on
Nov 24, 2004
Sold by
Zimmerman Lee F and Zimmerman Georgene S
Bought by
Zimmerman Lee F and Zimmerman Georgene S
Create a Home Valuation Report for This Property
The Home Valuation Report is an in-depth analysis detailing your home's value as well as a comparison with similar homes in the area
Home Values in the Area
Average Home Value in this Area
Purchase History
| Date | Buyer | Sale Price | Title Company |
|---|---|---|---|
| Wrisley Nicole | $200,000 | -- | |
| Wrisley Nicole | $200,000 | -- | |
| Cross Cindy | $232,000 | -- | |
| Cross Cindy | $232,000 | -- | |
| Zimmerman Lee F | -- | -- | |
| Zimmerman Lee F | -- | -- |
Source: Public Records
Mortgage History
| Date | Status | Borrower | Loan Amount |
|---|---|---|---|
| Open | Wrisley Nicole | $160,000 | |
| Closed | Wrisley Nicole | $160,000 | |
| Previous Owner | Zimmerman Lee F | $62,000 | |
| Previous Owner | Zimmerman Lee F | $25,000 | |
| Previous Owner | Cross Cindy | $220,400 |
Source: Public Records
Tax History Compared to Growth
Tax History
| Year | Tax Paid | Tax Assessment Tax Assessment Total Assessment is a certain percentage of the fair market value that is determined by local assessors to be the total taxable value of land and additions on the property. | Land | Improvement |
|---|---|---|---|---|
| 2025 | $5,719 | $292,400 | $83,600 | $208,800 |
| 2024 | $5,683 | $278,700 | $71,200 | $207,500 |
| 2023 | $5,140 | $261,600 | $71,200 | $190,400 |
| 2022 | $5,274 | $236,300 | $71,400 | $164,900 |
| 2021 | $5,241 | $225,700 | $75,400 | $150,300 |
| 2020 | $5,070 | $221,100 | $75,400 | $145,700 |
| 2019 | $4,720 | $211,100 | $65,800 | $145,300 |
| 2018 | $4,652 | $207,400 | $64,600 | $142,800 |
| 2017 | $4,507 | $207,400 | $64,600 | $142,800 |
| 2016 | $4,512 | $206,900 | $64,600 | $142,300 |
| 2015 | $4,448 | $197,600 | $66,200 | $131,400 |
| 2014 | $4,057 | $197,600 | $66,200 | $131,400 |
Source: Public Records
Map
Nearby Homes
- 20 B Phyllis Ln
- 24 Cypress St
- 23-25 Alden St
- 187 Plain Rd
- 311 Chapman St
- 22 Pine St
- 306 Davis St
- 35-37 Shattuck St
- 35 Shattuck St Unit 37
- 192 Wells St
- 250 Plain Rd
- 11 Beech St
- 116-120 Elm St
- 335 Federal St
- 185 Davis St
- 22 Princeton Terrace Unit 22
- 36 West St
- 75 Phillips St
- 14 Warner St
- 102 Conway St