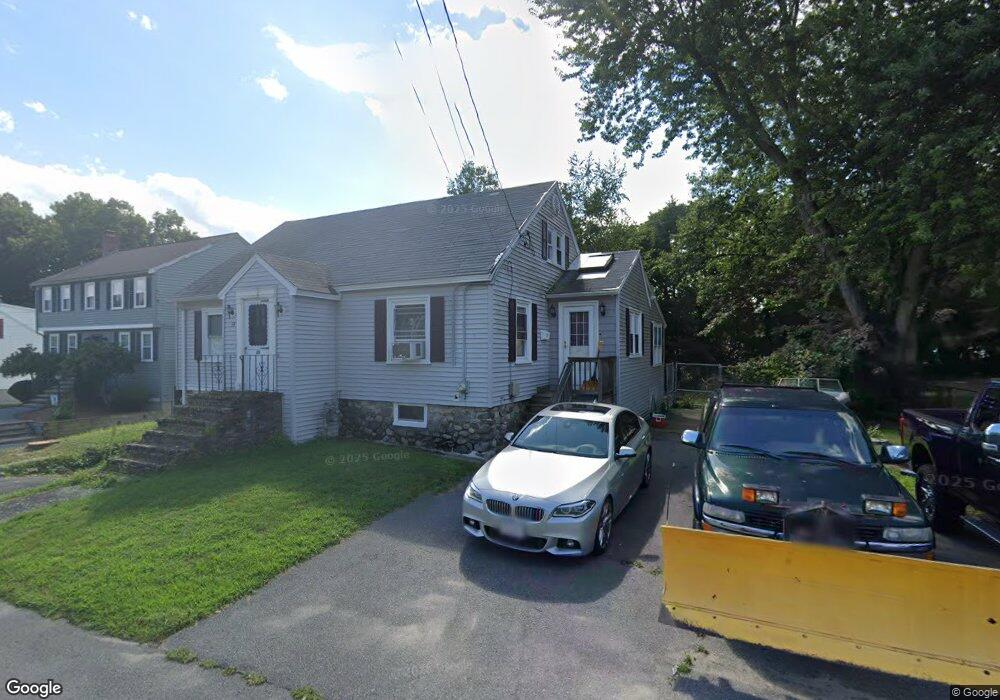
39 Lincoln St Methuen, MA 01844
Downtown Methuen NeighborhoodEstimated Value: $485,000 - $660,000
4
Beds
2
Baths
1,950
Sq Ft
$292/Sq Ft
Est. Value
About This Home
This home is located at 39 Lincoln St, Methuen, MA 01844 and is currently estimated at $569,587, approximately $292 per square foot. 39 Lincoln St is a home located in Essex County with nearby schools including Tenney Grammar School, Methuen High School, and The Islamic Academy For Peace.
Ownership History
Date
Name
Owned For
Owner Type
Purchase Details
Closed on
Jul 31, 2000
Sold by
Torres Mark S
Bought by
Long Richard T
Current Estimated Value
Home Financials for this Owner
Home Financials are based on the most recent Mortgage that was taken out on this home.
Original Mortgage
$130,500
Interest Rate
8.18%
Mortgage Type
Purchase Money Mortgage
Purchase Details
Closed on
Nov 2, 1989
Sold by
Torres John
Bought by
Torres Michael
Create a Home Valuation Report for This Property
The Home Valuation Report is an in-depth analysis detailing your home's value as well as a comparison with similar homes in the area
Home Values in the Area
Average Home Value in this Area
Purchase History
| Date | Buyer | Sale Price | Title Company |
|---|---|---|---|
| Long Richard T | $145,000 | -- | |
| Long Richard T | $145,000 | -- | |
| Torres Michael | $152,000 | -- | |
| Torres Michael | $152,000 | -- |
Source: Public Records
Mortgage History
| Date | Status | Borrower | Loan Amount |
|---|---|---|---|
| Open | Torres Michael | $76,800 | |
| Open | Torres Michael | $135,050 | |
| Closed | Torres Michael | $130,500 |
Source: Public Records
Tax History
| Year | Tax Paid | Tax Assessment Tax Assessment Total Assessment is a certain percentage of the fair market value that is determined by local assessors to be the total taxable value of land and additions on the property. | Land | Improvement |
|---|---|---|---|---|
| 2025 | $5,091 | $481,200 | $212,700 | $268,500 |
| 2024 | $5,024 | $462,600 | $194,100 | $268,500 |
| 2023 | $4,680 | $400,000 | $172,500 | $227,500 |
| 2022 | $4,419 | $338,600 | $143,700 | $194,900 |
| 2021 | $4,200 | $318,400 | $136,600 | $181,800 |
| 2020 | $4,209 | $313,200 | $136,600 | $176,600 |
| 2019 | $3,989 | $281,100 | $122,200 | $158,900 |
| 2018 | $3,901 | $273,400 | $122,200 | $151,200 |
| 2017 | $3,775 | $257,700 | $122,200 | $135,500 |
| 2016 | $3,517 | $237,500 | $115,000 | $122,500 |
| 2015 | $3,371 | $230,900 | $115,000 | $115,900 |
Source: Public Records
Map
Nearby Homes
- 945 Riverside Dr Unit 8A
- 945 Riverside Dr Unit 3B
- 16 Green St
- 22 Falcon St
- 65 Clayton Ave
- 71 N Lowell St
- 76 Haverhill St
- 2 Landmark Dr
- 13 Caswell Ave
- 14-16 Cypress Ave
- 1 Perry Ave
- 3 Oxyoke Dr
- 1146 Essex St
- 35 Maplewood Ave
- 192 Lowell St
- 1100 Essex St
- 1082 Essex St
- 750 Brookside Dr Unit G
- 1008 Essex St Unit 1010
- 7 Field Ave
Your Personal Tour Guide
Ask me questions while you tour the home.