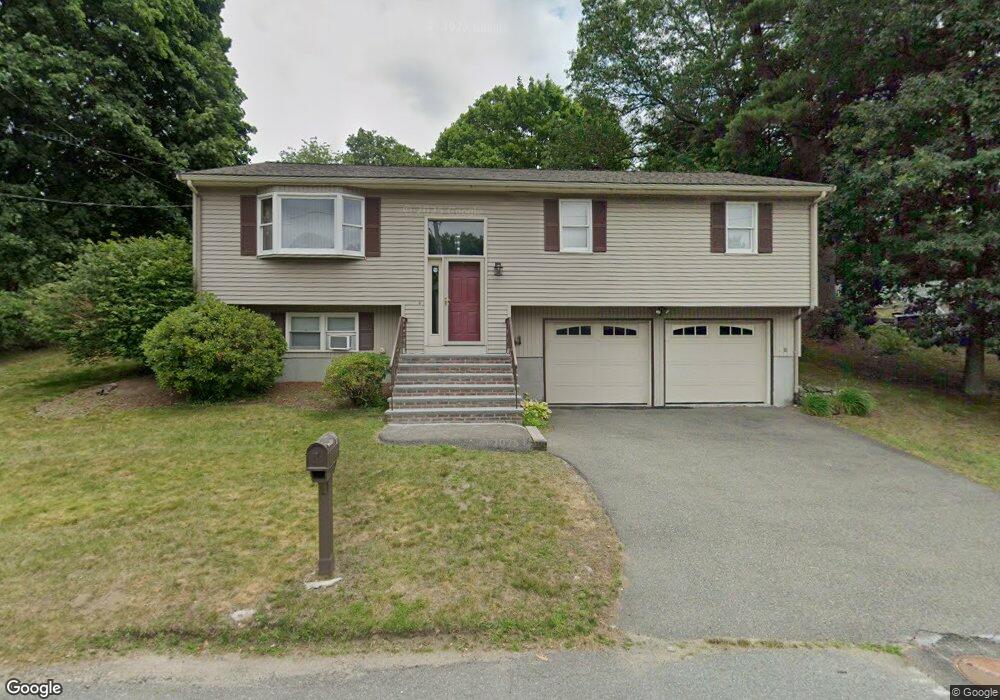
39 Longwood Ave Saugus, MA 01906
Downtown Saugus NeighborhoodEstimated Value: $757,242 - $859,000
3
Beds
2
Baths
1,952
Sq Ft
$420/Sq Ft
Est. Value
About This Home
This home is located at 39 Longwood Ave, Saugus, MA 01906 and is currently estimated at $820,061, approximately $420 per square foot. 39 Longwood Ave is a home located in Essex County with nearby schools including Saugus High School, Pioneer Charter School Of Science II, and Sacred Heart School.
Ownership History
Date
Name
Owned For
Owner Type
Purchase Details
Closed on
Jun 8, 2021
Sold by
Defronzo Marianne L
Bought by
Thurston Julianne and Mcfarland Jennifer M
Current Estimated Value
Purchase Details
Closed on
Aug 30, 2013
Sold by
Peczka David P and Defronzo Marianne L
Bought by
Defronzo Marianne L
Purchase Details
Closed on
May 22, 1992
Sold by
Procopio Construction
Bought by
Peczka David P and Peczka Marianne
Create a Home Valuation Report for This Property
The Home Valuation Report is an in-depth analysis detailing your home's value as well as a comparison with similar homes in the area
Home Values in the Area
Average Home Value in this Area
Purchase History
| Date | Buyer | Sale Price | Title Company |
|---|---|---|---|
| Thurston Julianne | -- | None Available | |
| Defronzo Marianne L | -- | -- | |
| Peczka David P | $150,000 | -- |
Source: Public Records
Mortgage History
| Date | Status | Borrower | Loan Amount |
|---|---|---|---|
| Previous Owner | Peczka David P | $87,000 | |
| Previous Owner | Peczka David P | $25,000 | |
| Previous Owner | Peczka David P | $68,500 |
Source: Public Records
Tax History
| Year | Tax Paid | Tax Assessment Tax Assessment Total Assessment is a certain percentage of the fair market value that is determined by local assessors to be the total taxable value of land and additions on the property. | Land | Improvement |
|---|---|---|---|---|
| 2025 | $7,074 | $662,400 | $325,800 | $336,600 |
| 2024 | $6,786 | $637,200 | $307,200 | $330,000 |
| 2023 | $6,572 | $583,700 | $270,000 | $313,700 |
| 2022 | $6,529 | $543,600 | $247,600 | $296,000 |
| 2021 | $6,276 | $508,600 | $215,100 | $293,500 |
| 2020 | $5,829 | $489,000 | $204,800 | $284,200 |
| 2019 | $5,547 | $455,400 | $186,200 | $269,200 |
| 2018 | $5,085 | $439,100 | $180,600 | $258,500 |
| 2017 | $4,807 | $398,900 | $168,500 | $230,400 |
| 2016 | $4,614 | $378,200 | $168,300 | $209,900 |
| 2015 | $4,328 | $360,100 | $160,200 | $199,900 |
| 2014 | $3,787 | $326,200 | $160,200 | $166,000 |
Source: Public Records
Map
Nearby Homes
- 57 Vine St
- 34 Summer St
- 43 Taylor St
- 7 Nirvana Dr
- 148 Forest St
- 36 Jasper St
- 7 Adams Ave
- 7 Blacksmith Way
- 5 Thomas St Unit 8
- 25 Auburn St
- 67 Saville St
- 52 Hesper St
- 29 Susan Dr
- 12B Cheever Ave
- 12C Cheever Ave
- 348 Lynn Fells Pkwy
- 24 Palmetto St
- 141 Essex St Unit D6
- 141 Essex St Unit B4
- 86 Lynn Fells Pkwy
Your Personal Tour Guide
Ask me questions while you tour the home.