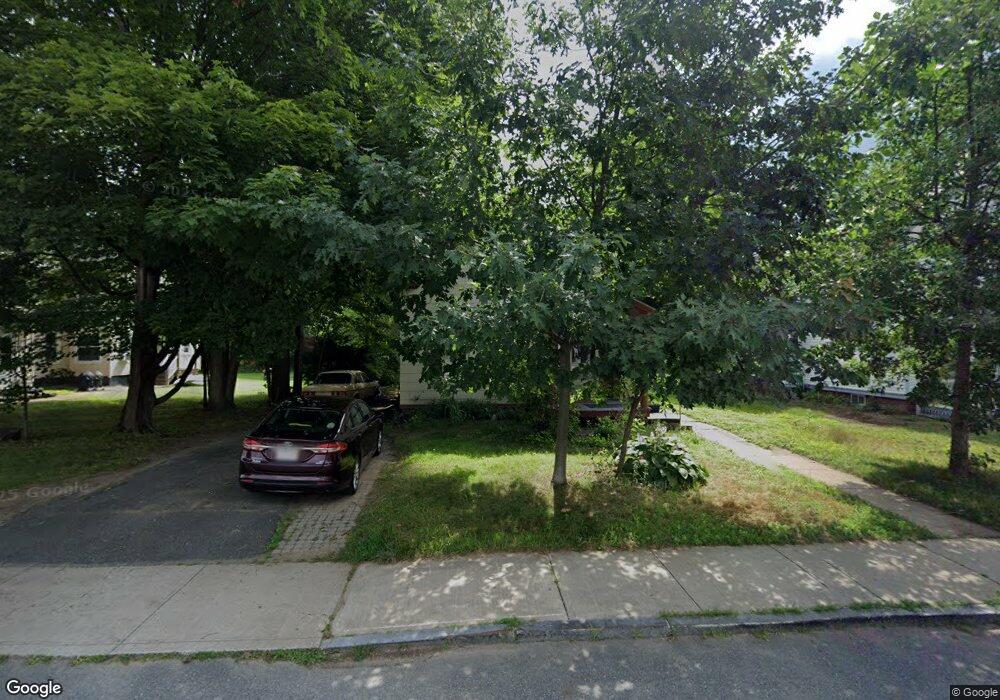
39 Main St Shelburne Falls, MA 01370
Estimated Value: $327,747 - $419,000
6
Beds
2
Baths
2,423
Sq Ft
$160/Sq Ft
Est. Value
About This Home
This home is located at 39 Main St, Shelburne Falls, MA 01370 and is currently estimated at $387,937, approximately $160 per square foot. 39 Main St is a home located in Franklin County with nearby schools including Mohawk Trail Regional High School.
Ownership History
Date
Name
Owned For
Owner Type
Purchase Details
Closed on
Jul 21, 2004
Sold by
Amstein William G and Amstein Vickie L
Bought by
Eichholz John F and Waters Patricia
Current Estimated Value
Home Financials for this Owner
Home Financials are based on the most recent Mortgage that was taken out on this home.
Original Mortgage
$184,500
Interest Rate
6.28%
Mortgage Type
Purchase Money Mortgage
Purchase Details
Closed on
Oct 20, 1998
Sold by
Est Shippee Marvin J and Shippee Lawrence P
Bought by
Amstein William G and Amstein Vickie L
Create a Home Valuation Report for This Property
The Home Valuation Report is an in-depth analysis detailing your home's value as well as a comparison with similar homes in the area
Home Values in the Area
Average Home Value in this Area
Purchase History
| Date | Buyer | Sale Price | Title Company |
|---|---|---|---|
| Eichholz John F | $205,000 | -- | |
| Amstein William G | $75,000 | -- |
Source: Public Records
Mortgage History
| Date | Status | Borrower | Loan Amount |
|---|---|---|---|
| Open | Amstein William G | $167,000 | |
| Closed | Amstein William G | $184,500 |
Source: Public Records
Tax History
| Year | Tax Paid | Tax Assessment Tax Assessment Total Assessment is a certain percentage of the fair market value that is determined by local assessors to be the total taxable value of land and additions on the property. | Land | Improvement |
|---|---|---|---|---|
| 2025 | $3,525 | $274,500 | $78,900 | $195,600 |
| 2024 | $3,621 | $273,100 | $78,900 | $194,200 |
| 2023 | $3,503 | $256,600 | $78,900 | $177,700 |
| 2022 | $3,711 | $256,100 | $78,900 | $177,200 |
| 2021 | $3,487 | $241,000 | $71,700 | $169,300 |
| 2020 | $3,289 | $235,300 | $75,300 | $160,000 |
| 2019 | $3,110 | $216,100 | $71,700 | $144,400 |
| 2018 | $3,207 | $203,500 | $60,200 | $143,300 |
| 2017 | $3,022 | $203,500 | $60,200 | $143,300 |
| 2015 | $3,038 | $218,700 | $61,200 | $157,500 |
| 2014 | $2,979 | $218,700 | $61,200 | $157,500 |
Source: Public Records
Map
Nearby Homes
- 10 Deerfield Ave Unit 2
- 13 Bray Rd
- 102 Elm St
- 2151 Route 2
- 2155 Massachusetts 2
- 7 Hog Hollow Rd
- 143 E Buckland Rd
- 31 W Oxbow Rd
- 24 W Oxbow Rd
- 0 Upper St
- 0 W Oxbow Rd Unit 73453651
- 0 W Oxbow Rd Unit 248444
- 1451 Massachusetts 2
- 1451 Route 2 E
- 5 Clesson Brook Rd
- 85 Dacey Rd
- lot 1 Shelburne Falls Rd
- 240 Beldingville Rd
- 8 Deer Run Path
- 151 Smead Hill Rd
Your Personal Tour Guide
Ask me questions while you tour the home.