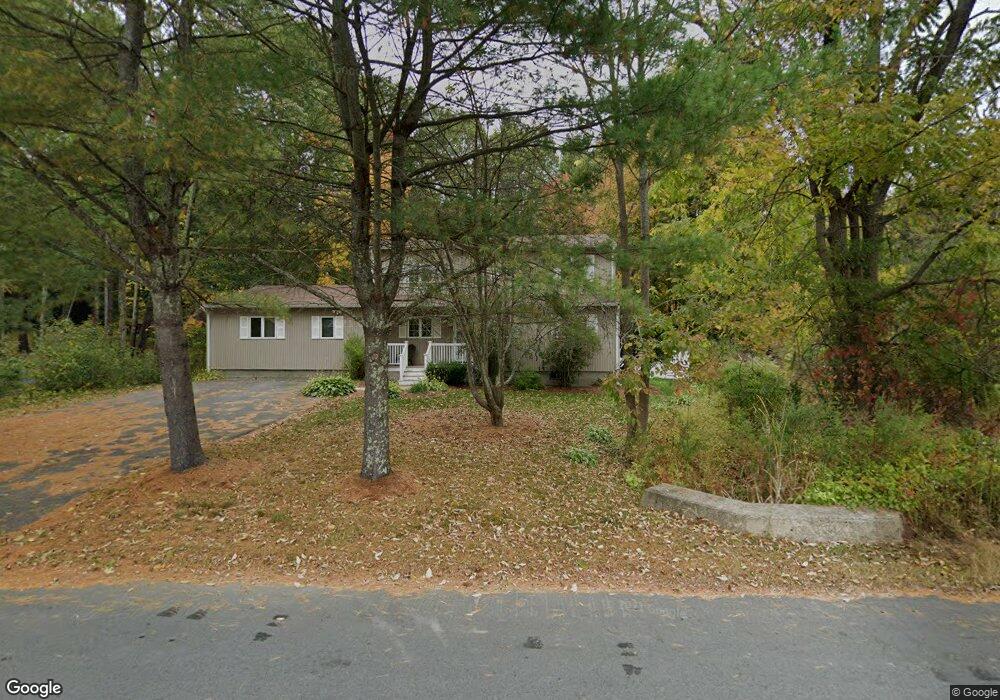
39 Maple St Methuen, MA 01844
The North End NeighborhoodEstimated Value: $637,633 - $811,000
4
Beds
3
Baths
2,084
Sq Ft
$341/Sq Ft
Est. Value
About This Home
This home is located at 39 Maple St, Methuen, MA 01844 and is currently estimated at $710,158, approximately $340 per square foot. 39 Maple St is a home located in Essex County with nearby schools including Methuen High School and Hilltop School.
Ownership History
Date
Name
Owned For
Owner Type
Purchase Details
Closed on
Apr 23, 2025
Sold by
Tibert William and Tibert Donna
Bought by
William & Donna Tibert Lt and Tibert
Current Estimated Value
Purchase Details
Closed on
May 31, 2011
Sold by
Arnold Christine M
Bought by
Tisbert William and Tisbert Donna
Home Financials for this Owner
Home Financials are based on the most recent Mortgage that was taken out on this home.
Original Mortgage
$280,250
Interest Rate
4.94%
Mortgage Type
Purchase Money Mortgage
Create a Home Valuation Report for This Property
The Home Valuation Report is an in-depth analysis detailing your home's value as well as a comparison with similar homes in the area
Home Values in the Area
Average Home Value in this Area
Purchase History
| Date | Buyer | Sale Price | Title Company |
|---|---|---|---|
| William & Donna Tibert Lt | -- | None Available | |
| William & Donna Tibert Lt | -- | None Available | |
| Tisbert William | $295,000 | -- | |
| Tisbert William | $295,000 | -- |
Source: Public Records
Mortgage History
| Date | Status | Borrower | Loan Amount |
|---|---|---|---|
| Previous Owner | Tisbert William | $280,250 |
Source: Public Records
Tax History
| Year | Tax Paid | Tax Assessment Tax Assessment Total Assessment is a certain percentage of the fair market value that is determined by local assessors to be the total taxable value of land and additions on the property. | Land | Improvement |
|---|---|---|---|---|
| 2025 | $5,931 | $560,600 | $260,400 | $300,200 |
| 2024 | $5,890 | $542,400 | $237,500 | $304,900 |
| 2023 | $5,615 | $479,900 | $211,100 | $268,800 |
| 2022 | $5,418 | $415,200 | $175,900 | $239,300 |
| 2021 | $5,079 | $385,100 | $167,100 | $218,000 |
| 2020 | $5,094 | $379,000 | $167,100 | $211,900 |
| 2019 | $4,952 | $349,000 | $149,600 | $199,400 |
| 2018 | $4,983 | $349,200 | $149,600 | $199,600 |
| 2017 | $4,791 | $327,000 | $149,600 | $177,400 |
| 2016 | $4,570 | $308,600 | $140,800 | $167,800 |
Source: Public Records
Map
Nearby Homes
- 55 Phoebe St Unit 32
- 40 Phoebe St Unit 101
- 127 Phoebe St Unit 67
- 125 Phoebe St Unit 125
- 11 Brookside Ct
- 2 Sequoia Dr Unit 2
- 64 Pine Tree Dr Unit 64
- 47 Bailey Ct
- 139 North St
- 7 Tree Top Way
- 159-161 Howe St
- 3 Adams Ave
- 34 Danforth Ct Unit 34
- 1513 Broadway
- 74 Ayers Village Rd
- 12 Scotland Heights Rd
- 9 Falcon Ln
- 28 Currier Ave
- 64-66 Howe St
- 29 Emma Rose Cir Unit Lot 22
Your Personal Tour Guide
Ask me questions while you tour the home.