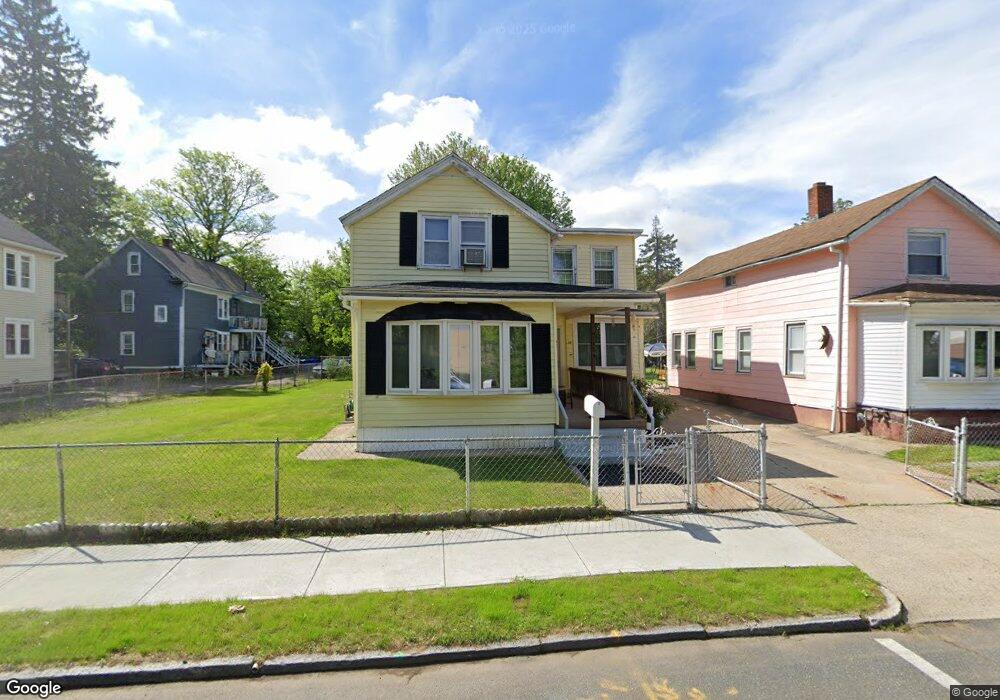
39 Monroe St Springfield, MA 01109
Old Hill NeighborhoodEstimated Value: $174,000 - $280,000
3
Beds
3
Baths
1,470
Sq Ft
$154/Sq Ft
Est. Value
About This Home
This home is located at 39 Monroe St, Springfield, MA 01109 and is currently estimated at $226,823, approximately $154 per square foot. 39 Monroe St is a home located in Hampden County with nearby schools including William N. DeBerry Elementary School, M Marcus Kiley Middle, and High School Of Commerce.
Ownership History
Date
Name
Owned For
Owner Type
Purchase Details
Closed on
Aug 31, 1989
Sold by
Davidson Arnold R
Bought by
Nieves Luis
Current Estimated Value
Home Financials for this Owner
Home Financials are based on the most recent Mortgage that was taken out on this home.
Original Mortgage
$45,000
Interest Rate
9.7%
Mortgage Type
Purchase Money Mortgage
Create a Home Valuation Report for This Property
The Home Valuation Report is an in-depth analysis detailing your home's value as well as a comparison with similar homes in the area
Home Values in the Area
Average Home Value in this Area
Purchase History
| Date | Buyer | Sale Price | Title Company |
|---|---|---|---|
| Nieves Luis | $60,000 | -- |
Source: Public Records
Mortgage History
| Date | Status | Borrower | Loan Amount |
|---|---|---|---|
| Open | Nieves Luis | $39,000 | |
| Closed | Nieves Luis | $45,000 | |
| Closed | Nieves Luis | $3,500 | |
| Previous Owner | Nieves Luis | $45,000 |
Source: Public Records
Tax History
| Year | Tax Paid | Tax Assessment Tax Assessment Total Assessment is a certain percentage of the fair market value that is determined by local assessors to be the total taxable value of land and additions on the property. | Land | Improvement |
|---|---|---|---|---|
| 2025 | $2,327 | $148,400 | $25,500 | $122,900 |
| 2024 | $1,926 | $119,900 | $23,800 | $96,100 |
| 2023 | $2,152 | $126,200 | $22,700 | $103,500 |
| 2022 | $2,262 | $120,200 | $20,600 | $99,600 |
| 2021 | $2,223 | $117,600 | $18,800 | $98,800 |
| 2020 | $2,125 | $108,800 | $18,800 | $90,000 |
| 2019 | $1,984 | $100,800 | $18,800 | $82,000 |
| 2018 | $1,732 | $88,000 | $18,800 | $69,200 |
| 2017 | $1,695 | $86,200 | $15,000 | $71,200 |
| 2016 | $1,710 | $87,000 | $15,000 | $72,000 |
| 2015 | $1,688 | $85,800 | $15,000 | $70,800 |
Source: Public Records
Map
Nearby Homes
- 29 Monroe St
- 27 Monroe St
- 45 1/2 Monroe St
- 51 Monroe St
- 644 Union St
- 650 Union St
- 658 Union St
- 667 Union St
- 8 Monroe St Unit First floor
- 665 Union St
- 677 Union St
- 677 Union St Unit 2
- 679 Union St Unit 2
- 679 Union St
- 661 Union St
- 683 Union St
- 37 Hancock St
- 647 Union St
- 687 Union St Unit 689
- 176 Quincy St
Your Personal Tour Guide
Ask me questions while you tour the home.