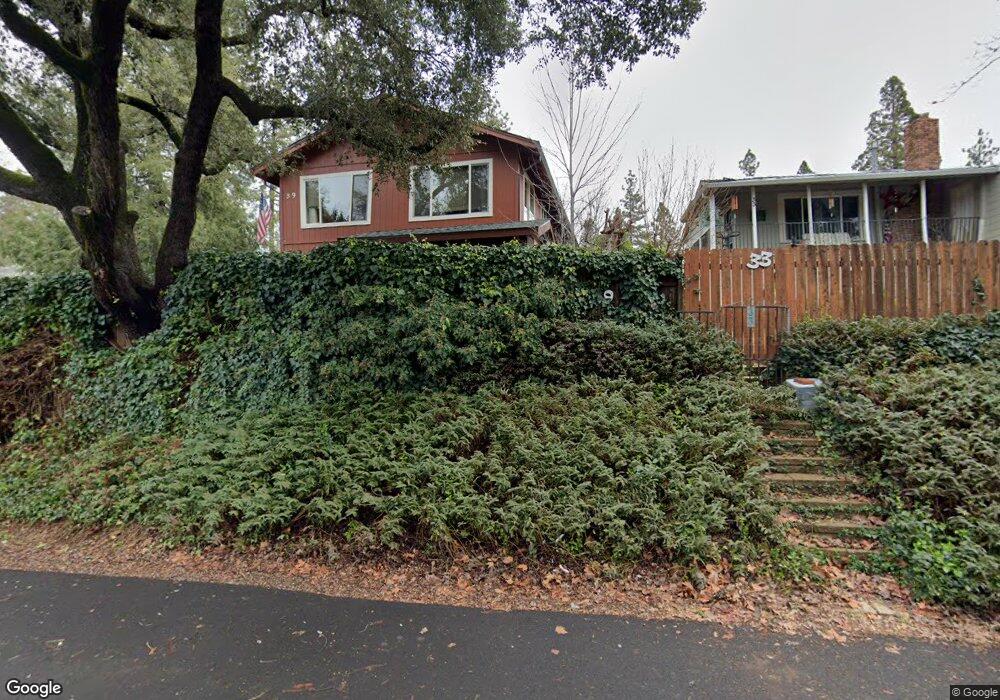
39 N Forest Hill St Colfax, CA 95713
Estimated Value: $360,000 - $456,000
3
Beds
2
Baths
1,212
Sq Ft
$344/Sq Ft
Est. Value
About This Home
This home is located at 39 N Forest Hill St, Colfax, CA 95713 and is currently estimated at $416,649, approximately $343 per square foot. 39 N Forest Hill St is a home with nearby schools including Colfax Elementary School, Colfax High School, and Chicago Park Community Charter School.
Ownership History
Date
Name
Owned For
Owner Type
Purchase Details
Closed on
Aug 27, 2019
Sold by
Coverston Steven and Coverston Patricia
Bought by
Coverston Patricia
Current Estimated Value
Purchase Details
Closed on
Jun 23, 2005
Sold by
Haylor Samuel John and Haylor Kecia Amy
Bought by
Coverston Steven and Coverston Patricia
Home Financials for this Owner
Home Financials are based on the most recent Mortgage that was taken out on this home.
Original Mortgage
$284,000
Outstanding Balance
$147,214
Interest Rate
5.65%
Mortgage Type
Fannie Mae Freddie Mac
Estimated Equity
$269,435
Purchase Details
Closed on
Nov 19, 1997
Sold by
Delcol Aldo and Delcol Graziano
Bought by
Haylor Samuel John and Haylor Kecia Amy
Home Financials for this Owner
Home Financials are based on the most recent Mortgage that was taken out on this home.
Original Mortgage
$98,504
Interest Rate
7.33%
Mortgage Type
Purchase Money Mortgage
Create a Home Valuation Report for This Property
The Home Valuation Report is an in-depth analysis detailing your home's value as well as a comparison with similar homes in the area
Home Values in the Area
Average Home Value in this Area
Purchase History
| Date | Buyer | Sale Price | Title Company |
|---|---|---|---|
| Coverston Patricia | -- | None Available | |
| Coverston Steven | $355,000 | Old Republic Title | |
| Haylor Samuel John | $133,000 | Placer Title Company | |
| Delcol Aldo | -- | Placer Title Company |
Source: Public Records
Mortgage History
| Date | Status | Borrower | Loan Amount |
|---|---|---|---|
| Open | Coverston Steven | $284,000 | |
| Previous Owner | Haylor Samuel John | $98,504 | |
| Closed | Haylor Samuel John | $24,495 |
Source: Public Records
Tax History Compared to Growth
Tax History
| Year | Tax Paid | Tax Assessment Tax Assessment Total Assessment is a certain percentage of the fair market value that is determined by local assessors to be the total taxable value of land and additions on the property. | Land | Improvement |
|---|---|---|---|---|
| 2025 | $3,762 | $385,000 | $108,400 | $276,600 |
| 2023 | $3,762 | $353,000 | $99,400 | $253,600 |
| 2022 | $3,641 | $353,000 | $99,400 | $253,600 |
| 2021 | $3,155 | $307,000 | $86,500 | $220,500 |
| 2020 | $2,995 | $292,000 | $82,300 | $209,700 |
| 2019 | $3,057 | $298,000 | $83,900 | $214,100 |
| 2018 | $2,946 | $292,000 | $82,300 | $209,700 |
| 2017 | $3,485 | $336,825 | $94,900 | $241,925 |
| 2016 | $3,155 | $305,141 | $86,000 | $219,141 |
| 2015 | $2,915 | $284,090 | $80,000 | $204,090 |
| 2014 | $2,788 | $270,000 | $76,100 | $193,900 |
Source: Public Records
Map
Nearby Homes
- 0 Kneeland St Unit 225109849
- 9 Rising Sun Rd
- 309 S Auburn St
- 150 W Oak St
- 230 Rising Sun Rd
- 30 Lincoln St
- 147 Scholtz Ave
- 38 Lincoln St
- 24580 View Cape Horn Ave
- 208 Rising Sun Rd
- 333 Pine St
- 24275 Grand View Ave
- 212 Glendale Rd
- 895 Sunray Ln
- 70 Iowa Hill Rd
- 155 Whitcomb Ave
- 1333 California 174
- 508 Chase Ct
- 1333 Pinecroft Rd
- 500 Chase Ct
- 33 N Forest Hill St
- 37 N Northstar Ave
- 204 Marvin Way
- 55 N Forest Hill St
- 42 N Forest Hill St
- 204 Marvin Ave
- 210 Marvin Ave
- 14 N Forest Hill St
- 12 N Forest Hill St
- 11 N Northstar Ave
- 40 Sunrise Ave
- 40 Sunrise Ave
- 40 Sunrise Ave Unit 1
- 169 Depot St
- 35 N Auburn St
- 33 S Auburn St
- 201 Marvin Ave
- 201 Marvin Way
- 11 N Auburn St
- 206 Vista Ave