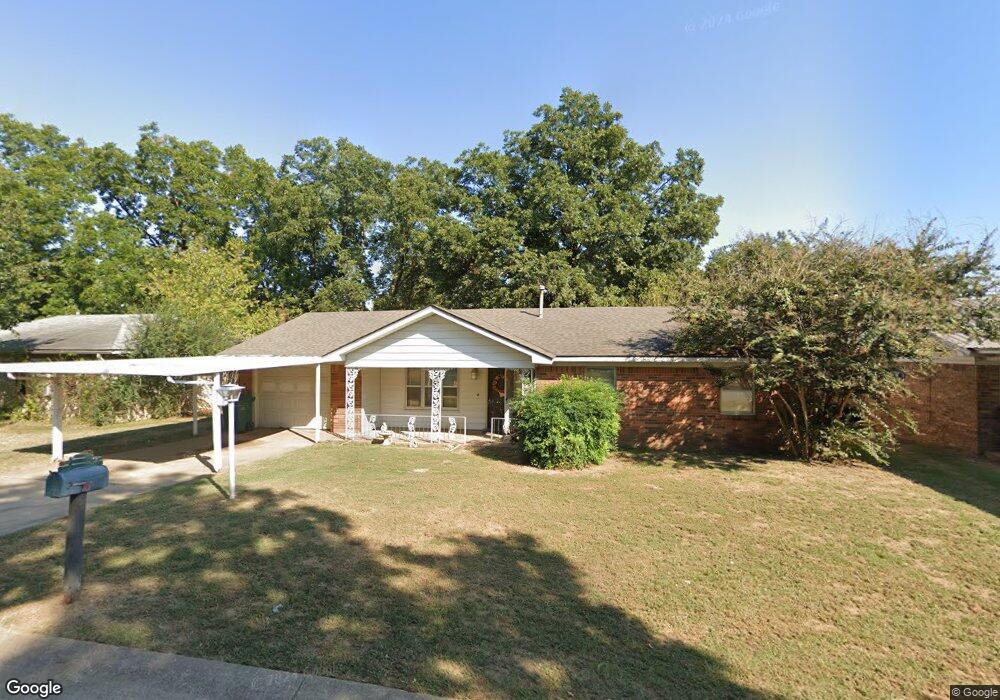
39 N Redwood Dr Sallisaw, OK 74955
Estimated Value: $119,000 - $148,000
3
Beds
1
Bath
996
Sq Ft
$128/Sq Ft
Est. Value
About This Home
This home is located at 39 N Redwood Dr, Sallisaw, OK 74955 and is currently estimated at $127,938, approximately $128 per square foot. 39 N Redwood Dr is a home located in Sequoyah County with nearby schools including Liberty Elementary School, Eastside Elementary School, and Sallisaw Middle School.
Ownership History
Date
Name
Owned For
Owner Type
Purchase Details
Closed on
May 29, 2025
Sold by
Avery Karen
Bought by
Karen Avery Revocable Trust
Current Estimated Value
Purchase Details
Closed on
May 2, 2011
Sold by
Keffel Dale and Keffel Carolyn
Bought by
Avery Karen
Home Financials for this Owner
Home Financials are based on the most recent Mortgage that was taken out on this home.
Original Mortgage
$60,000
Interest Rate
4.82%
Mortgage Type
Purchase Money Mortgage
Purchase Details
Closed on
Sep 28, 2010
Sold by
High Pont Investments Llc
Bought by
Keffel Dale and Keffel Carolyn
Purchase Details
Closed on
Jun 25, 2010
Sold by
Board Of Trustee Of The Church Of Christ
Bought by
High Point Investments Llc
Purchase Details
Closed on
Jan 8, 2005
Sold by
Sherwood E H and Sherwood Othal
Bought by
The Church Of Christ
Create a Home Valuation Report for This Property
The Home Valuation Report is an in-depth analysis detailing your home's value as well as a comparison with similar homes in the area
Home Values in the Area
Average Home Value in this Area
Purchase History
| Date | Buyer | Sale Price | Title Company |
|---|---|---|---|
| Karen Avery Revocable Trust | -- | None Listed On Document | |
| Avery Karen Denise | -- | None Listed On Document | |
| Avery Karen | $74,000 | None Available | |
| Keffel Dale | $74,000 | None Available | |
| High Point Investments Llc | $42,000 | None Available | |
| The Church Of Christ | -- | None Available |
Source: Public Records
Mortgage History
| Date | Status | Borrower | Loan Amount |
|---|---|---|---|
| Previous Owner | Avery Karen | $60,000 |
Source: Public Records
Tax History Compared to Growth
Tax History
| Year | Tax Paid | Tax Assessment Tax Assessment Total Assessment is a certain percentage of the fair market value that is determined by local assessors to be the total taxable value of land and additions on the property. | Land | Improvement |
|---|---|---|---|---|
| 2024 | $700 | $7,707 | $880 | $6,827 |
| 2023 | $700 | $7,340 | $880 | $6,460 |
| 2022 | $596 | $6,991 | $880 | $6,111 |
| 2021 | $595 | $6,991 | $880 | $6,111 |
| 2020 | $597 | $6,884 | $773 | $6,111 |
| 2019 | $487 | $6,556 | $440 | $6,116 |
| 2018 | $504 | $6,705 | $440 | $6,265 |
| 2017 | $503 | $6,710 | $440 | $6,270 |
| 2016 | $435 | $6,875 | $440 | $6,435 |
| 2015 | $549 | $7,040 | $440 | $6,600 |
| 2014 | $472 | $7,200 | $440 | $6,760 |
Source: Public Records
Map
Nearby Homes
- 60 N Redwood Cir
- 414 N Dogwood St
- 402 N Dogwood St
- 406 N Dogwood St
- 320 N Dogwood St
- TBD Mitchell St
- 830 E Chickasaw Place
- 1705 E Fryar Dr
- 701 E Chickasaw Ave
- 831 E Mary Ave
- 300 S Fryar Dr
- 1122 Green St
- 400 S Fryar Dr
- 703 E Ida Ave
- 2500 E McGee Dr
- 406 S McGee Dr
- 504 E Choctaw Ave
- 503 S Fryar Dr
- 412 Ridge Dr
- 402 S Cherry St
- 40 N Redwood Dr
- 38 N Redwood Dr
- 42 N Redwood Dr
- 43 N Redwood Cir
- 37 N Redwood Dr
- 41 N Redwood Cir
- 28 N Redwood Dr
- 44 N Redwood Cir
- 44 N Redwood Cir
- 29 N Redwood Dr
- 27 N Redwood Dr
- 30 N Redwood Dr
- 45 N Redwood Cir
- 31 N Redwood Dr
- 35 N Redwood Dr
- 25 N Redwood Ln
- 64 N Redwood Cir
- 46 N Redwood Dr
- 63 N Redwood Cir
- 26 N Redwood Ln