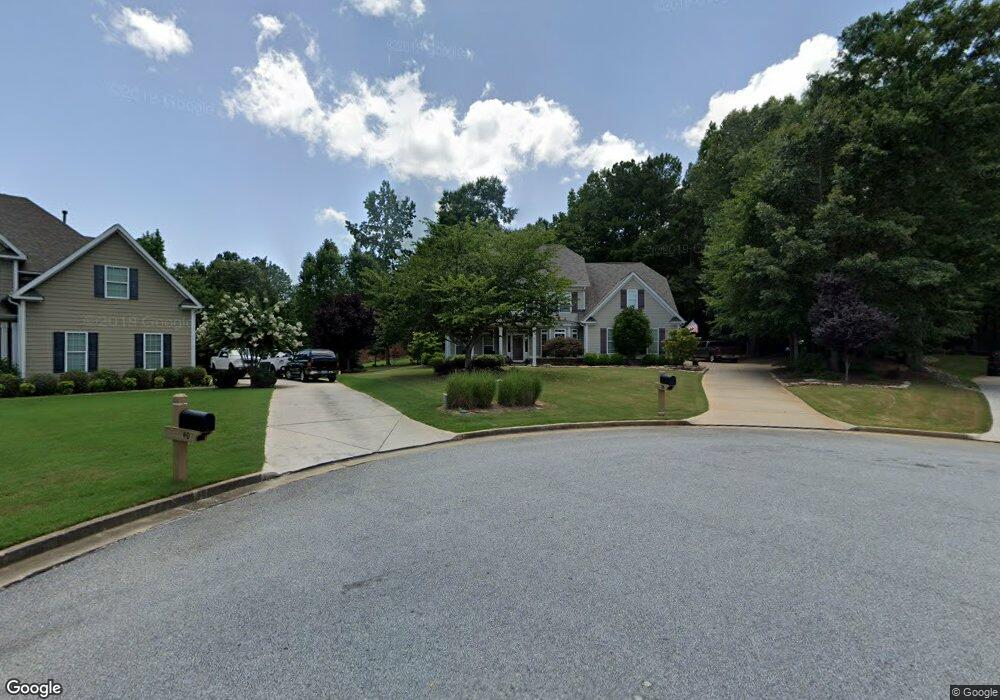
39 Nash Island Ln Unit 1 Sharpsburg, GA 30277
Estimated Value: $489,617 - $600,000
4
Beds
4
Baths
2,548
Sq Ft
$216/Sq Ft
Est. Value
About This Home
This home is located at 39 Nash Island Ln Unit 1, Sharpsburg, GA 30277 and is currently estimated at $550,904, approximately $216 per square foot. 39 Nash Island Ln Unit 1 is a home located in Coweta County with nearby schools including Canongate Elementary School, Madras Middle School, and Northgate High School.
Ownership History
Date
Name
Owned For
Owner Type
Purchase Details
Closed on
Jun 5, 2025
Sold by
Mcready Barbara A
Bought by
Mcready Barbara A and Mcready Walter P
Current Estimated Value
Purchase Details
Closed on
Sep 4, 2014
Sold by
Mcready Walter
Bought by
Mcready Walter P and Mcready Barbara A
Home Financials for this Owner
Home Financials are based on the most recent Mortgage that was taken out on this home.
Original Mortgage
$235,000
Interest Rate
4.2%
Mortgage Type
New Conventional
Purchase Details
Closed on
Nov 14, 2005
Sold by
Lichty Bros Const Inc
Bought by
Mcready Walter and Mcready Barbara
Home Financials for this Owner
Home Financials are based on the most recent Mortgage that was taken out on this home.
Original Mortgage
$14,710
Interest Rate
5.9%
Mortgage Type
New Conventional
Purchase Details
Closed on
Jul 18, 2005
Sold by
Rockport Inc
Bought by
Parnell Od0m H
Purchase Details
Closed on
Jul 27, 1993
Bought by
Rockport Inc
Create a Home Valuation Report for This Property
The Home Valuation Report is an in-depth analysis detailing your home's value as well as a comparison with similar homes in the area
Home Values in the Area
Average Home Value in this Area
Purchase History
| Date | Buyer | Sale Price | Title Company |
|---|---|---|---|
| Mcready Barbara A | -- | -- | |
| Mcready Walter P | $203,406 | -- | |
| Mcready Walter | $294,300 | -- | |
| Lichty Bros Construction Inc | $1,000 | -- | |
| Parnell Od0m H | $2,332,400 | -- | |
| Rockport Inc | $843,600 | -- |
Source: Public Records
Mortgage History
| Date | Status | Borrower | Loan Amount |
|---|---|---|---|
| Previous Owner | Mcready Walter P | $235,000 | |
| Previous Owner | Lichty Bros Construction Inc | $14,710 | |
| Previous Owner | Lichty Bros Construction Inc | $14,710 | |
| Previous Owner | Lichty Bros Construction Inc | $235,374 |
Source: Public Records
Tax History Compared to Growth
Tax History
| Year | Tax Paid | Tax Assessment Tax Assessment Total Assessment is a certain percentage of the fair market value that is determined by local assessors to be the total taxable value of land and additions on the property. | Land | Improvement |
|---|---|---|---|---|
| 2025 | $4,625 | $195,744 | $42,000 | $153,744 |
| 2024 | $4,235 | $182,448 | $42,000 | $140,448 |
| 2023 | $4,235 | $175,930 | $30,000 | $145,930 |
| 2022 | $3,778 | $153,380 | $28,000 | $125,380 |
| 2021 | $3,680 | $139,803 | $28,000 | $111,803 |
| 2020 | $3,705 | $139,803 | $28,000 | $111,803 |
| 2019 | $3,834 | $130,977 | $22,000 | $108,977 |
| 2018 | $3,840 | $130,977 | $22,000 | $108,977 |
| 2017 | $3,687 | $125,788 | $22,000 | $103,788 |
| 2016 | $3,643 | $125,788 | $22,000 | $103,788 |
| 2015 | $3,328 | $116,892 | $22,000 | $94,892 |
| 2014 | $3,196 | $113,185 | $22,000 | $91,185 |
Source: Public Records
Map
Nearby Homes
- 12 Race Point Way
- 319 Beaconsfield Dr
- 125 Cannongate Cir
- 131 Cannongate Cir
- 95 Tyler Woods Dr
- 259 Strathmore Dr Unit 3
- 25 Sycamore Way
- 10 Monteray Ct
- 2043 Fischer Rd
- 2039 Fischer Rd
- 121 Northwoods Rd
- 75 Tomahawk Dr
- 40 Wenham Ln
- 10 Fisher Way
- 70 N Strathmore Dr
- 20 Skipton Ct
- 68 Timbercreek Estates
- 68 Timbercreek Estates Dr
- 972 Raymond Hill Rd
- 851 Raymond Hill Rd
- 40 Nash Island Ln
- 35 Nash Island Ln Unit 1
- 36 Nash Island Ln
- 28 Stranahan Ct
- 97 Saddleback Ledge Way
- 0 Nash Island Ln NE
- 71 Saddleback Ledge Way
- 91 Saddleback Ledge Way
- 10 Nash Island Ln
- 85 Sandisfield Dr
- 29 Stranahan Ct
- 29 Stranahan Ct Unit 16
- 65 Sandisfield Dr Unit 1
- 127 Sandisfield Dr
- 57 Saddleback Ledge Way
- 143 Sandisfield Dr
- 167 Sandisfield Dr
- 43 Saddleback Ledge Way
- 100 Saddleback Ledge Way
- 18 Stranahan Ct