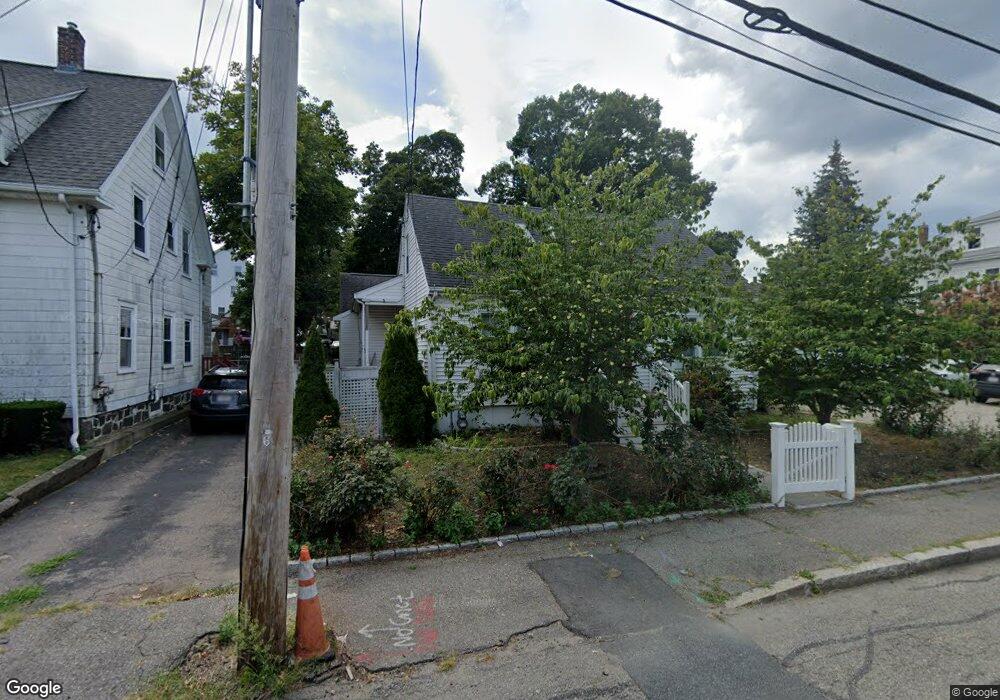
39 Newcomb St Quincy, MA 02169
Quincy Center NeighborhoodEstimated Value: $865,000 - $1,028,000
1
Bed
1
Bath
800
Sq Ft
$1,206/Sq Ft
Est. Value
About This Home
This home is located at 39 Newcomb St, Quincy, MA 02169 and is currently estimated at $964,549, approximately $1,205 per square foot. 39 Newcomb St is a home located in Norfolk County with nearby schools including Point Webster Middle School, Clifford H. Marshall Elementary School, and Quincy High School.
Ownership History
Date
Name
Owned For
Owner Type
Purchase Details
Closed on
Jan 31, 2013
Sold by
Bhatnagar Renuka
Bought by
Bhatnagar Renuka and Steward Brendan
Current Estimated Value
Home Financials for this Owner
Home Financials are based on the most recent Mortgage that was taken out on this home.
Original Mortgage
$400,000
Outstanding Balance
$277,861
Interest Rate
3.35%
Mortgage Type
New Conventional
Estimated Equity
$686,688
Create a Home Valuation Report for This Property
The Home Valuation Report is an in-depth analysis detailing your home's value as well as a comparison with similar homes in the area
Home Values in the Area
Average Home Value in this Area
Purchase History
| Date | Buyer | Sale Price | Title Company |
|---|---|---|---|
| Bhatnagar Renuka | -- | -- | |
| Bhatnagar Renuka | -- | -- |
Source: Public Records
Mortgage History
| Date | Status | Borrower | Loan Amount |
|---|---|---|---|
| Open | Bhatnagar Renuka | $400,000 | |
| Closed | Bhatnagar Renuka | $50,000 | |
| Closed | Bhatnagar Renuka | $400,000 |
Source: Public Records
Tax History
| Year | Tax Paid | Tax Assessment Tax Assessment Total Assessment is a certain percentage of the fair market value that is determined by local assessors to be the total taxable value of land and additions on the property. | Land | Improvement |
|---|---|---|---|---|
| 2025 | $9,500 | $823,900 | $316,200 | $507,700 |
| 2024 | $9,071 | $804,900 | $301,600 | $503,300 |
| 2023 | $8,292 | $745,000 | $275,000 | $470,000 |
| 2022 | $8,639 | $721,100 | $250,800 | $470,300 |
| 2021 | $8,107 | $667,800 | $250,800 | $417,000 |
| 2020 | $8,387 | $674,700 | $239,200 | $435,500 |
| 2019 | $7,643 | $609,000 | $226,200 | $382,800 |
| 2018 | $7,920 | $593,700 | $226,200 | $367,500 |
| 2017 | $7,357 | $519,200 | $208,800 | $310,400 |
| 2016 | $7,100 | $494,400 | $208,800 | $285,600 |
| 2015 | $6,869 | $470,500 | $208,800 | $261,700 |
| 2014 | $6,022 | $441,400 | $208,800 | $232,600 |
Source: Public Records
Map
Nearby Homes
- 66 Mcgrath Hwy Unit 302
- 66 Mcgrath Hwy Unit 402
- 66 Mcgrath Hwy Unit 309
- 66 Mcgrath Hwy Unit 201
- 59 Spear St Unit 201
- 59 Spear St Unit 302
- 59 Spear St Unit 402
- 59 Spear St Unit 202
- 59 Spear St Unit 301
- 28 Edgewood Cir
- 35 Miller Stile Rd
- 20 Whitney Rd Unit 1
- 20 Whitney Rd Unit 6
- 20 Whitney Rd Unit 2
- 2 Cliveden St Unit 601E
- 2 Cliveden St Unit 405E
- 5 Main St
- 18 Cliveden St Unit 406W
- 18 Cliveden St Unit 205W
- 195 Thomas Burgin Pkwy Unit 212
- 39 Newcomb St Unit 2
- 39 Newcomb St Unit 1
- 35 Newcomb St
- 35 Newcomb St Unit 1
- 43 Newcomb St
- 49 Newcomb St
- 49 Newcomb St Unit 2
- 51 Newcomb St
- 49 Newcomb St Unit 1
- 29-39 Newcomb St
- 29 Newcomb St
- 31 Newcomb St
- 31 Newcomb St Unit 2
- 21 Granville St
- 17 Granville St
- 17 Granville St Unit 1
- 17 Granville St Unit 2
- 999 Newcomb St
- 42 Newcomb St
- 36 Newcomb St
Your Personal Tour Guide
Ask me questions while you tour the home.