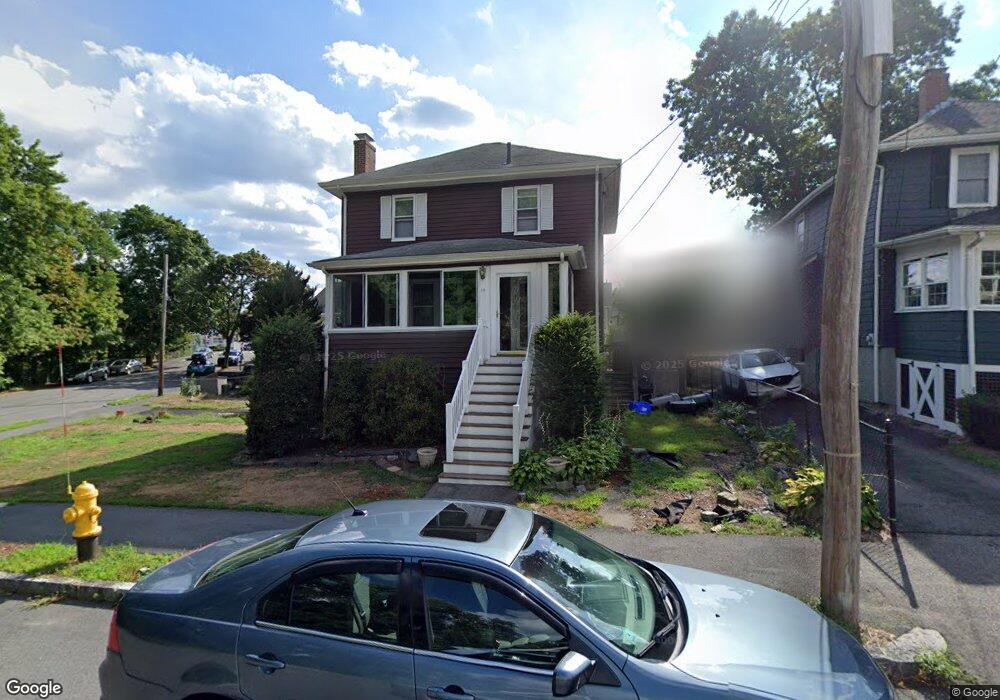
39 Newfield St Quincy, MA 02170
Montclair NeighborhoodEstimated Value: $643,000 - $700,000
3
Beds
2
Baths
1,248
Sq Ft
$542/Sq Ft
Est. Value
About This Home
This home is located at 39 Newfield St, Quincy, MA 02170 and is currently estimated at $676,896, approximately $542 per square foot. 39 Newfield St is a home located in Norfolk County with nearby schools including Montclair Elementary School, Atlantic Middle School, and North Quincy High School.
Create a Home Valuation Report for This Property
The Home Valuation Report is an in-depth analysis detailing your home's value as well as a comparison with similar homes in the area
Home Values in the Area
Average Home Value in this Area
Tax History Compared to Growth
Tax History
| Year | Tax Paid | Tax Assessment Tax Assessment Total Assessment is a certain percentage of the fair market value that is determined by local assessors to be the total taxable value of land and additions on the property. | Land | Improvement |
|---|---|---|---|---|
| 2025 | $7,070 | $613,200 | $337,700 | $275,500 |
| 2024 | $6,849 | $607,700 | $337,700 | $270,000 |
| 2023 | $6,375 | $572,800 | $321,600 | $251,200 |
| 2022 | $6,115 | $510,400 | $279,700 | $230,700 |
| 2021 | $5,825 | $479,800 | $266,300 | $213,500 |
| 2020 | $5,786 | $465,500 | $266,300 | $199,200 |
| 2019 | $5,507 | $438,800 | $248,900 | $189,900 |
| 2018 | $5,420 | $406,300 | $230,500 | $175,800 |
| 2017 | $5,365 | $378,600 | $219,500 | $159,100 |
| 2016 | $4,892 | $340,700 | $190,900 | $149,800 |
| 2015 | $4,539 | $310,900 | $173,500 | $137,400 |
| 2014 | $4,327 | $291,200 | $165,200 | $126,000 |
Source: Public Records
Map
Nearby Homes
- 129-131 Pine St
- 169 Pine St
- 171 Milton St
- 51 Denmark Ave
- 26 Berlin Ave
- 11 Rockwell Ave
- 121 Hillside Ave
- 18 Eaton St
- 143 Arlington St
- 250 Fayette St
- 115 W Squantum St Unit 907
- 115 W Squantum St Unit 810
- 45 Marion St
- 60 Pond St
- 17 Holmes St Unit 2
- 17 Holmes St Unit 4
- 41 Wallace Rd
- 55 Christopher Dr
- 312 Edge Hill Rd
- 10 White St