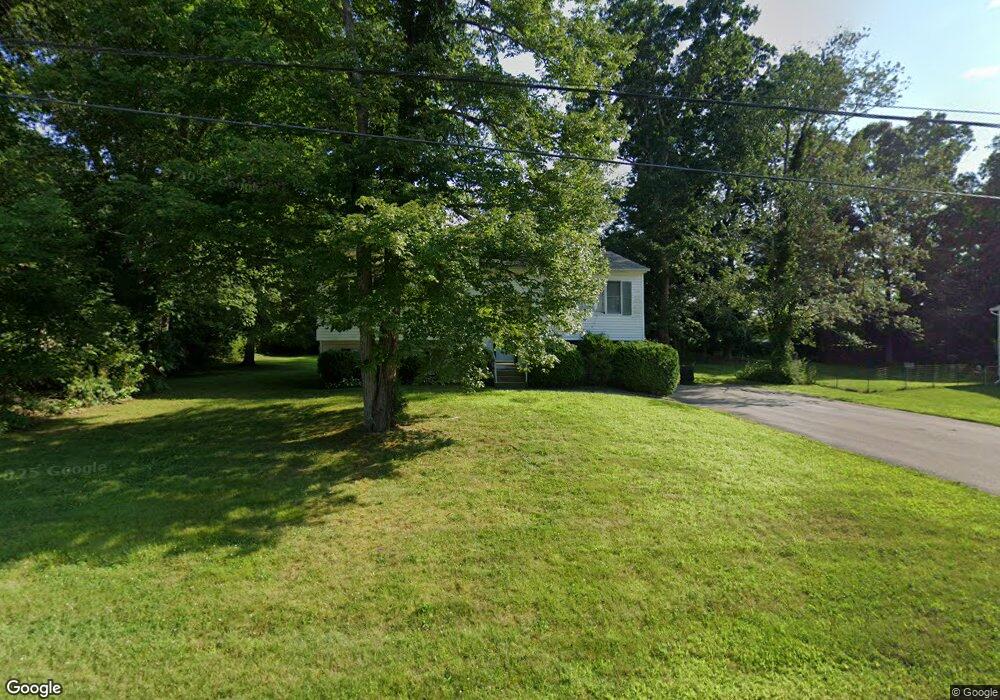
39 Oakwood Blvd Plainfield, CT 06374
Estimated Value: $304,793 - $370,000
4
Beds
2
Baths
1,028
Sq Ft
$328/Sq Ft
Est. Value
About This Home
This home is located at 39 Oakwood Blvd, Plainfield, CT 06374 and is currently estimated at $337,448, approximately $328 per square foot. 39 Oakwood Blvd is a home located in Windham County with nearby schools including Plainfield Memorial School, Plainfield Central Middle School, and Plainfield High School.
Ownership History
Date
Name
Owned For
Owner Type
Purchase Details
Closed on
Jan 6, 2022
Sold by
Rolf Rose M
Bought by
Jones Jeremiah
Current Estimated Value
Purchase Details
Closed on
Oct 13, 2009
Sold by
Fnma
Bought by
Jones Jeremiah and Rolf Rose M
Purchase Details
Closed on
Aug 3, 2009
Sold by
Nationwide Advantage M
Bought by
Federal National Mortgage Association
Purchase Details
Closed on
Jul 25, 2001
Sold by
Wells Greig L and Wells Teresa E
Bought by
Stepanian Daniel P and Stepanian Sandra J
Purchase Details
Closed on
Jun 21, 1996
Sold by
Adams Ernest C and Adams Nancy D
Bought by
Wells Greig L and Wells Teresa
Create a Home Valuation Report for This Property
The Home Valuation Report is an in-depth analysis detailing your home's value as well as a comparison with similar homes in the area
Home Values in the Area
Average Home Value in this Area
Purchase History
| Date | Buyer | Sale Price | Title Company |
|---|---|---|---|
| Jones Jeremiah | -- | None Available | |
| Jones Jeremiah | -- | None Available | |
| Jones Jeremiah | $170,000 | -- | |
| Jones Jeremiah | $170,000 | -- | |
| Federal National Mortgage Association | -- | -- | |
| Nationwide Advantage M | $183,500 | -- | |
| Federal National Mortgage Association | -- | -- | |
| Stepanian Daniel P | $109,000 | -- | |
| Stepanian Daniel P | $109,000 | -- | |
| Wells Greig L | $85,000 | -- | |
| Wells Greig L | $85,000 | -- |
Source: Public Records
Mortgage History
| Date | Status | Borrower | Loan Amount |
|---|---|---|---|
| Previous Owner | Wells Greig L | $167,891 | |
| Previous Owner | Wells Greig L | $167,891 |
Source: Public Records
Tax History Compared to Growth
Tax History
| Year | Tax Paid | Tax Assessment Tax Assessment Total Assessment is a certain percentage of the fair market value that is determined by local assessors to be the total taxable value of land and additions on the property. | Land | Improvement |
|---|---|---|---|---|
| 2025 | $3,589 | $154,430 | $31,150 | $123,280 |
| 2024 | $3,448 | $154,430 | $31,150 | $123,280 |
| 2023 | $3,431 | $154,430 | $31,150 | $123,280 |
| 2022 | $4,380 | $98,710 | $26,930 | $71,780 |
| 2021 | $2,974 | $98,710 | $26,930 | $71,780 |
| 2020 | $2,964 | $98,710 | $26,930 | $71,780 |
| 2019 | $2,964 | $98,710 | $26,930 | $71,780 |
| 2018 | $2,928 | $98,710 | $26,930 | $71,780 |
| 2017 | $2,956 | $93,500 | $28,340 | $65,160 |
| 2016 | $2,852 | $93,500 | $28,340 | $65,160 |
| 2015 | $2,787 | $93,500 | $28,340 | $65,160 |
| 2014 | $2,787 | $93,500 | $28,340 | $65,160 |
Source: Public Records
Map
Nearby Homes
- 13 Beechwood Blvd
- 128 Lathrop Rd
- 0 Dow Rd Unit 24128109
- 146 Lathrop Rd
- 26 Perkins St
- 0 Pond St Unit 24037041
- 0A Norwich Rd
- 00 Norwich Rd
- 36 Plainfield Pike
- 0 Plainfield Pike
- 33 Railroad Ave
- 75 Academy Hill Rd
- 34 Pleasant St Unit 3
- 34 Pleasant St Unit 7
- 462 Norwich Rd
- 2 Terrace Dr
- 12 Ann St
- 3 Terrace Dr
- 383 Lathrop Rd
- 49 Canterbury Rd Unit K
- 35 Oakwood Blvd
- 45 Oakwood Blvd
- 48 Fernwood St
- 47 Fernwood St
- 68 Fernwood St
- 31 Oakwood Blvd
- 48 Oakwood Blvd
- 3 Beechwood Blvd
- 40 Mapleshade Ave
- 25 Oakwood Blvd
- 39 Fernwood St
- 9 Beechwood Blvd
- 54 Oakwood Blvd
- 55 Oakwood Blvd
- 0 Beechwood Blvd
- 0 Beechwood Blvd Unit 170626225
- 0 Beechwood Blvd Unit 170591599
- 39 Mapleshade Ave
- 34 Mapleshade Ave
- 35 Fernwood St