39 Olean St Worcester, MA 01602
West Tatnuck NeighborhoodEstimated Value: $642,000 - $845,000
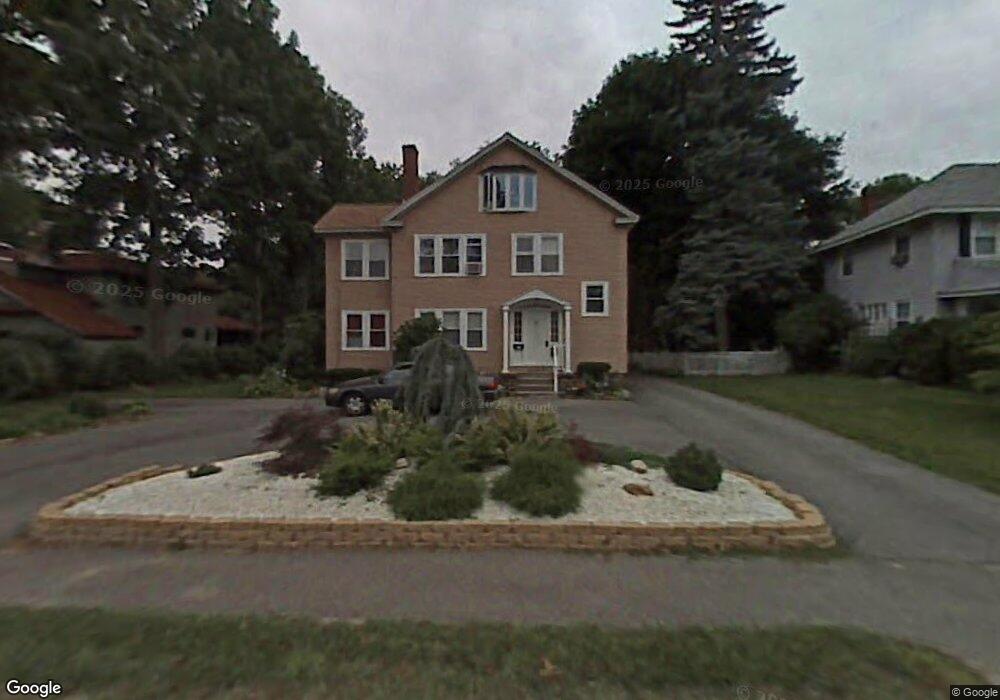
About This Home
This home is located at 39 Olean St, Worcester, MA 01602 and is currently estimated at $718,649, approximately $192 per square foot. 39 Olean St is a home located in Worcester County with nearby schools including Chandler Magnet, West Tatnuck School, and Jacob Hiatt Magnet School.
Ownership History
We collect this data history from publicly available records. To have your information removed, we recommend requesting removal directly through your county’s website.
Purchase Details
Home Values in the Area
Average Home Value in this Area
Purchase History
We collect this data history from publicly available records. To have your information removed, we recommend requesting removal directly through your county’s website.
| Date | Buyer | Sale Price | Title Company |
|---|---|---|---|
| $337,500 | -- |
Mortgage History
We collect this data history from publicly available records. To have your information removed, we recommend requesting removal directly through your county’s website.
| Date | Status | Borrower | Loan Amount |
|---|---|---|---|
| Closed | $123,000 | ||
| Closed | $101,000 | ||
| Closed | $201,000 | ||
| Closed | $140,000 | ||
| Closed | $153,000 |
Tax History
We collect this data history from publicly available records. To have your information removed, we recommend requesting removal directly through your county’s website.
| Year | Tax Paid | Tax Assessment Tax Assessment Total Assessment is a certain percentage of the fair market value that is determined by local assessors to be the total taxable value of land and additions on the property. | Land | Improvement |
|---|---|---|---|---|
| 2025 | $8,335 | $631,900 | $118,900 | $513,000 |
| 2024 | $7,954 | $578,500 | $118,900 | $459,600 |
| 2023 | $7,454 | $519,800 | $103,400 | $416,400 |
| 2022 | $7,243 | $476,200 | $82,700 | $393,500 |
| 2021 | $6,523 | $400,700 | $66,200 | $334,500 |
| 2020 | $6,088 | $358,100 | $66,200 | $291,900 |
| 2019 | $6,313 | $350,700 | $59,600 | $291,100 |
| 2018 | $5,296 | $325,500 | $59,600 | $265,900 |
| 2017 | $5,136 | $302,200 | $59,600 | $242,600 |
| 2016 | $5,804 | $281,600 | $44,200 | $237,400 |
| 2015 | $5,652 | $281,600 | $44,200 | $237,400 |
| 2014 | $5,502 | $281,600 | $44,200 | $237,400 |
Map
- 38 Tory Fort Ln
- 22 Lauf St
- 34 Wildrose Ave
- 20 Drexel St
- 31 Wildrose Ave
- 1231 Pleasant St
- 1066 Pleasant St
- 158 Copperfield Rd
- 2 Paradox Dr
- 148A Tory Fort Ln
- 22 Maxdale Rd
- 603 Chandler St
- 28 Greybert Ln
- 30 Marwood Rd
- 44 Merlin Ct Unit 44
- 14 Pinewood Ln
- 37 Moreland Green Dr
- 51 Brantwood Rd
- 44 Rustic Dr
- 1 Ashmore Rd
Ask me questions while you tour the home.