Estimated Value: $383,000 - $483,000
4
Beds
4
Baths
2,554
Sq Ft
$166/Sq Ft
Est. Value
About This Home
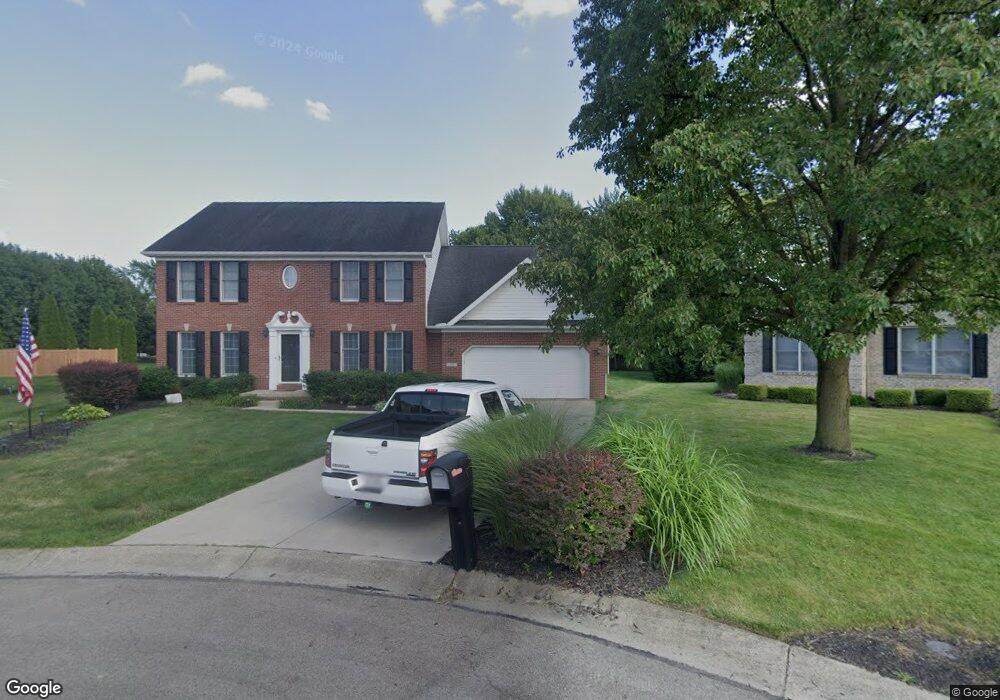
This home is located at 39 Osprey Ct, Piqua, OH 45356 and is currently estimated at $422,953, approximately $165 per square foot. 39 Osprey Ct is a home located in Miami County with nearby schools including Washington Primary School, Piqua Junior High School, and Piqua High School.
Ownership History
Date
Name
Owned For
Owner Type
Purchase Details
Closed on
Sep 8, 2005
Sold by
Lamphar Lance E and Lamphar Lori J
Bought by
Caulfield Matthew D and Caulfield Lynette D
Current Estimated Value
Home Financials for this Owner
Home Financials are based on the most recent Mortgage that was taken out on this home.
Original Mortgage
$215,100
Outstanding Balance
$111,792
Interest Rate
5.89%
Mortgage Type
New Conventional
Estimated Equity
$311,161
Purchase Details
Closed on
May 26, 1995
Sold by
Piqua Dev Twenty Inc
Bought by
Turner Daniel D
Create a Home Valuation Report for This Property
The Home Valuation Report is an in-depth analysis detailing your home's value as well as a comparison with similar homes in the area
Home Values in the Area
Average Home Value in this Area
Purchase History
| Date | Buyer | Sale Price | Title Company |
|---|---|---|---|
| Caulfield Matthew D | $239,000 | -- | |
| Turner Daniel D | $80,000 | -- |
Source: Public Records
Mortgage History
| Date | Status | Borrower | Loan Amount |
|---|---|---|---|
| Open | Caulfield Matthew D | $215,100 | |
| Closed | Turner Daniel D | -- |
Source: Public Records
Tax History
| Year | Tax Paid | Tax Assessment Tax Assessment Total Assessment is a certain percentage of the fair market value that is determined by local assessors to be the total taxable value of land and additions on the property. | Land | Improvement |
|---|---|---|---|---|
| 2025 | $4,108 | $116,380 | $10,850 | $105,530 |
| 2024 | $4,108 | $102,660 | $14,670 | $87,990 |
| 2023 | $4,219 | $102,660 | $14,670 | $87,990 |
| 2022 | $4,292 | $102,660 | $14,670 | $87,990 |
| 2021 | $3,475 | $76,020 | $10,850 | $65,170 |
| 2020 | $3,406 | $76,020 | $10,850 | $65,170 |
| 2019 | $3,424 | $76,020 | $10,850 | $65,170 |
| 2018 | $3,245 | $68,780 | $10,850 | $57,930 |
| 2017 | $3,285 | $68,780 | $10,850 | $57,930 |
| 2016 | $3,248 | $68,780 | $10,850 | $57,930 |
| 2015 | $3,324 | $68,780 | $10,850 | $57,930 |
| 2014 | $3,324 | $68,780 | $10,850 | $57,930 |
| 2013 | $3,335 | $68,780 | $10,850 | $57,930 |
Source: Public Records
Map
Nearby Homes
- 507 N Parkway Dr
- 1712 Park Ave
- 2 Orchard Dr
- 1839 Wilshire Dr
- 315 N Sunset Dr
- 800 Antler Ct
- 8460 N Bennett Dr
- 8460 Bennett Dr Unit C
- 413 Deerwood Dr
- 103 Lakewood Place
- 404 Spotted Doe Trail
- 1515 W High St
- 1102 Fountain Blvd
- 2113 Wilshire Dr
- 802 Washington Ave
- 1062 Boone St
- 1414 Washington Ave
- 1040 Camp St
- 1115 Madison Ave
- 618 Cherry St
Your Personal Tour Guide
Ask me questions while you tour the home.