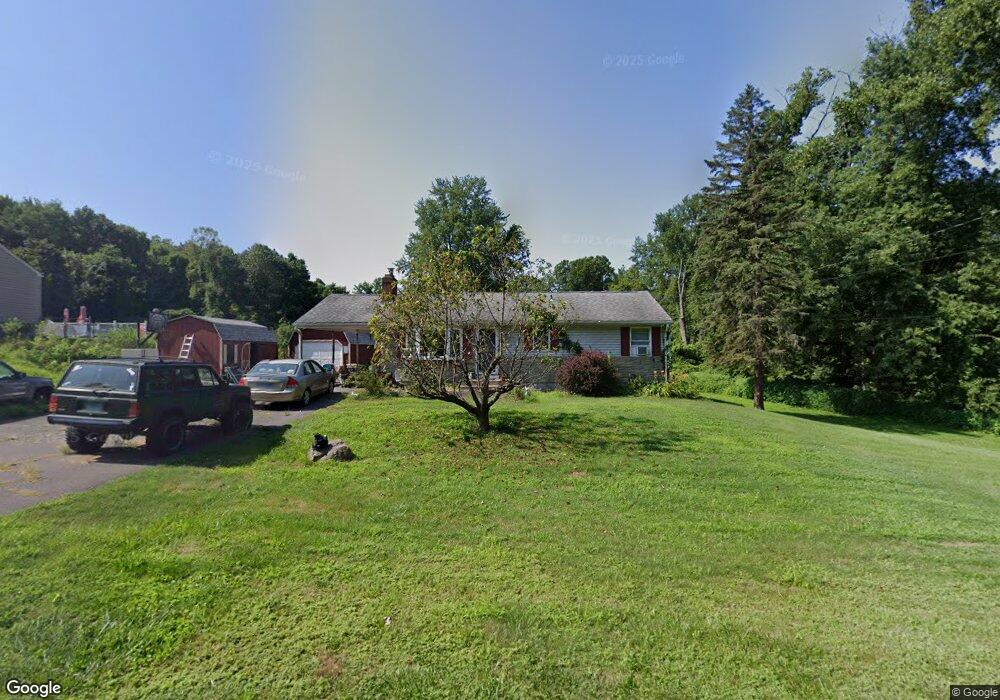
39 Parsons Rd Enfield, CT 06082
Estimated Value: $289,000 - $331,000
3
Beds
1
Bath
1,168
Sq Ft
$268/Sq Ft
Est. Value
About This Home
This home is located at 39 Parsons Rd, Enfield, CT 06082 and is currently estimated at $313,310, approximately $268 per square foot. 39 Parsons Rd is a home located in Hartford County with nearby schools including Enfield Street Elementary School, Edgar H. Parkman School, and Enfield High School.
Ownership History
Date
Name
Owned For
Owner Type
Purchase Details
Closed on
Nov 18, 2002
Sold by
Jorgensen Howard
Bought by
Nowell Craig and Nowell Laurie
Current Estimated Value
Purchase Details
Closed on
Sep 21, 1987
Sold by
Messech Donald
Bought by
Jogensew Howard
Home Financials for this Owner
Home Financials are based on the most recent Mortgage that was taken out on this home.
Original Mortgage
$90,000
Interest Rate
10.35%
Mortgage Type
Purchase Money Mortgage
Create a Home Valuation Report for This Property
The Home Valuation Report is an in-depth analysis detailing your home's value as well as a comparison with similar homes in the area
Home Values in the Area
Average Home Value in this Area
Purchase History
| Date | Buyer | Sale Price | Title Company |
|---|---|---|---|
| Nowell Craig | $159,000 | -- | |
| Jogensew Howard | $125,000 | -- |
Source: Public Records
Mortgage History
| Date | Status | Borrower | Loan Amount |
|---|---|---|---|
| Previous Owner | Jogensew Howard | $103,000 | |
| Previous Owner | Jogensew Howard | $108,000 | |
| Previous Owner | Jogensew Howard | $108,000 | |
| Previous Owner | Jogensew Howard | $90,000 |
Source: Public Records
Tax History
| Year | Tax Paid | Tax Assessment Tax Assessment Total Assessment is a certain percentage of the fair market value that is determined by local assessors to be the total taxable value of land and additions on the property. | Land | Improvement |
|---|---|---|---|---|
| 2025 | $5,210 | $148,900 | $58,600 | $90,300 |
| 2024 | $5,070 | $148,900 | $58,600 | $90,300 |
| 2023 | $5,033 | $148,900 | $58,600 | $90,300 |
| 2022 | $4,570 | $148,900 | $58,600 | $90,300 |
| 2021 | $4,318 | $115,060 | $48,650 | $66,410 |
| 2020 | $4,318 | $115,060 | $48,650 | $66,410 |
| 2019 | $4,330 | $115,060 | $48,650 | $66,410 |
| 2018 | $4,257 | $115,060 | $48,650 | $66,410 |
| 2017 | $4,019 | $115,060 | $48,650 | $66,410 |
| 2016 | $4,246 | $123,750 | $54,490 | $69,260 |
| 2015 | $4,113 | $123,750 | $54,490 | $69,260 |
| 2014 | $4,007 | $123,750 | $54,490 | $69,260 |
Source: Public Records
Map
Nearby Homes
Your Personal Tour Guide
Ask me questions while you tour the home.