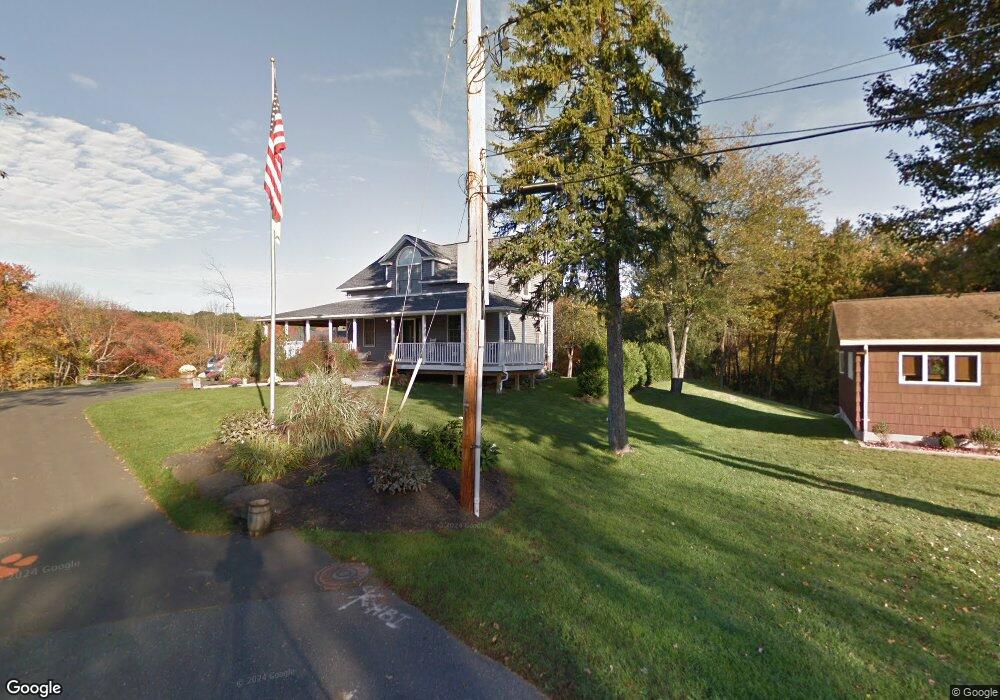
39 Pershing Ave South Hadley, MA 01075
Estimated Value: $425,000 - $555,428
4
Beds
2
Baths
2,310
Sq Ft
$221/Sq Ft
Est. Value
About This Home
This home is located at 39 Pershing Ave, South Hadley, MA 01075 and is currently estimated at $511,107, approximately $221 per square foot. 39 Pershing Ave is a home located in Hampshire County with nearby schools including Plains Elementary School, Mosier Elementary School, and Michael E. Smith Middle School.
Ownership History
Date
Name
Owned For
Owner Type
Purchase Details
Closed on
Mar 3, 2010
Sold by
Haber Benjamin J
Bought by
Haber Benjamin J and Haber Meghan E
Current Estimated Value
Purchase Details
Closed on
May 13, 2009
Sold by
Haber Benjamin J and Haber Meghan E
Bought by
Haber Benjamin J
Home Financials for this Owner
Home Financials are based on the most recent Mortgage that was taken out on this home.
Original Mortgage
$251,322
Interest Rate
4.85%
Mortgage Type
FHA
Purchase Details
Closed on
Jan 24, 2007
Sold by
Est Bednarz Amelia B
Bought by
Haber Benjamin J and Haber Meghan E
Home Financials for this Owner
Home Financials are based on the most recent Mortgage that was taken out on this home.
Original Mortgage
$70,000
Interest Rate
6.15%
Mortgage Type
Purchase Money Mortgage
Create a Home Valuation Report for This Property
The Home Valuation Report is an in-depth analysis detailing your home's value as well as a comparison with similar homes in the area
Home Values in the Area
Average Home Value in this Area
Purchase History
| Date | Buyer | Sale Price | Title Company |
|---|---|---|---|
| Haber Benjamin J | -- | -- | |
| Haber Benjamin J | -- | -- | |
| Haber Benjamin J | $160,000 | -- |
Source: Public Records
Mortgage History
| Date | Status | Borrower | Loan Amount |
|---|---|---|---|
| Previous Owner | Haber Benjamin J | $251,322 | |
| Previous Owner | Haber Benjamin J | $70,000 |
Source: Public Records
Tax History Compared to Growth
Tax History
| Year | Tax Paid | Tax Assessment Tax Assessment Total Assessment is a certain percentage of the fair market value that is determined by local assessors to be the total taxable value of land and additions on the property. | Land | Improvement |
|---|---|---|---|---|
| 2025 | $7,546 | $473,700 | $126,800 | $346,900 |
| 2024 | $7,319 | $439,600 | $117,700 | $321,900 |
| 2023 | $6,988 | $398,200 | $107,700 | $290,500 |
| 2022 | $6,590 | $356,600 | $107,700 | $248,900 |
| 2021 | $6,490 | $333,500 | $101,200 | $232,300 |
| 2020 | $6,319 | $316,900 | $101,200 | $215,700 |
| 2019 | $6,174 | $306,400 | $96,800 | $209,600 |
| 2018 | $5,937 | $297,900 | $94,200 | $203,700 |
| 2017 | $5,694 | $283,000 | $94,200 | $188,800 |
| 2016 | $5,584 | $281,300 | $94,200 | $187,100 |
| 2015 | $5,295 | $273,200 | $91,600 | $181,600 |
Source: Public Records
Map
Nearby Homes
- 318 Newton St
- 7 Hunter Terrace
- 84 Judd Ave
- 70 Lathrop St
- 85 Fairview St
- 47 Pynchon Rd
- 63 Washington Ave
- 133 Granby Rd
- 25 Noel St
- 19 Hildreth Ave
- 45 Shadow Brook Estate
- 32 North St
- 49 N Main St
- 41 W Summit St Unit 72
- 41 W Summit St Unit 54
- 41 W Summit St Unit 32
- 41 W Summit St Unit 55
- 88 Alvord St
- 27 Bardwell St Unit 4
- 0 Granby Rd