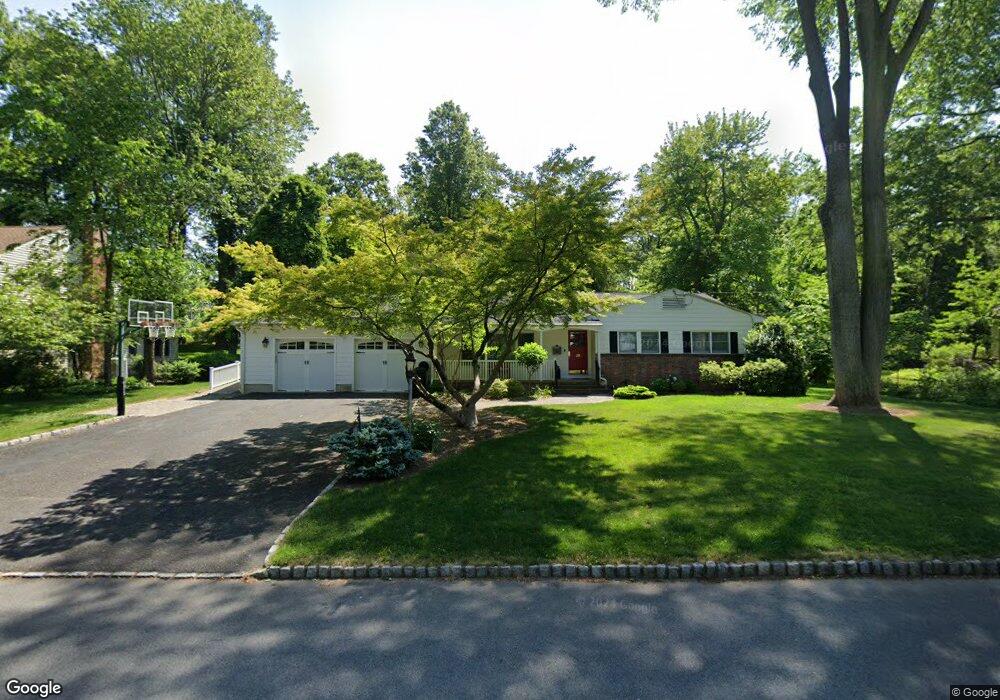
39 Pitney Ave New Providence, NJ 07974
Estimated Value: $721,000 - $1,064,000
--
Bed
--
Bath
2,112
Sq Ft
$439/Sq Ft
Est. Value
About This Home
This home is located at 39 Pitney Ave, New Providence, NJ 07974 and is currently estimated at $926,235, approximately $438 per square foot. 39 Pitney Ave is a home located in Union County with nearby schools including New Providence High School, The Academy of Our Lady of Peace, and Oak Knoll School of the Holy Child.
Ownership History
Date
Name
Owned For
Owner Type
Purchase Details
Closed on
Aug 16, 2004
Sold by
Annelli William
Bought by
Fraehmke Thomas and Fraehmke Marlene
Current Estimated Value
Home Financials for this Owner
Home Financials are based on the most recent Mortgage that was taken out on this home.
Original Mortgage
$100,000
Outstanding Balance
$49,655
Interest Rate
6.02%
Estimated Equity
$876,580
Purchase Details
Closed on
May 5, 1997
Sold by
Annelli William F and Annelli Louise
Bought by
Annelli William F and Annelli Louise
Create a Home Valuation Report for This Property
The Home Valuation Report is an in-depth analysis detailing your home's value as well as a comparison with similar homes in the area
Home Values in the Area
Average Home Value in this Area
Purchase History
| Date | Buyer | Sale Price | Title Company |
|---|---|---|---|
| Fraehmke Thomas | $520,000 | -- | |
| Annelli William F | -- | -- |
Source: Public Records
Mortgage History
| Date | Status | Borrower | Loan Amount |
|---|---|---|---|
| Open | Fraehmke Thomas | $100,000 |
Source: Public Records
Tax History Compared to Growth
Tax History
| Year | Tax Paid | Tax Assessment Tax Assessment Total Assessment is a certain percentage of the fair market value that is determined by local assessors to be the total taxable value of land and additions on the property. | Land | Improvement |
|---|---|---|---|---|
| 2025 | $16,761 | $324,700 | $141,300 | $183,400 |
| 2024 | $16,258 | $324,700 | $141,300 | $183,400 |
| 2023 | $16,258 | $324,700 | $141,300 | $183,400 |
| 2022 | $16,034 | $324,700 | $141,300 | $183,400 |
| 2021 | $15,917 | $324,700 | $141,300 | $183,400 |
| 2020 | $15,910 | $324,700 | $141,300 | $183,400 |
| 2019 | $15,813 | $324,700 | $141,300 | $183,400 |
| 2018 | $15,732 | $324,700 | $141,300 | $183,400 |
| 2017 | $15,475 | $324,700 | $141,300 | $183,400 |
| 2016 | $15,258 | $324,700 | $141,300 | $183,400 |
| 2015 | $15,047 | $324,700 | $141,300 | $183,400 |
| 2014 | $14,819 | $324,700 | $141,300 | $183,400 |
Source: Public Records
Map
Nearby Homes
- 197 Elkwood Ave
- 1200 Springfield Ave Unit 1B
- 100 Commonwealth Ave
- 54 Badgley Dr
- 29 Walton Ave
- 283 Riveredge Dr
- 32 Charnwood Rd
- 19 Division Ave
- 34 Grant Ave
- 146 Riveredge Dr
- 5 Kincaid Ln
- 32 Marion Ave
- 72 Central Ave
- 2F Terrace Dr Unit F
- 21G Heritage Dr Unit G
- 22C Heritage Dr Unit C
- 16 Riverbend Ct
- 20 High St
- 43 Passaic Ave
- 14 Holmes Oval