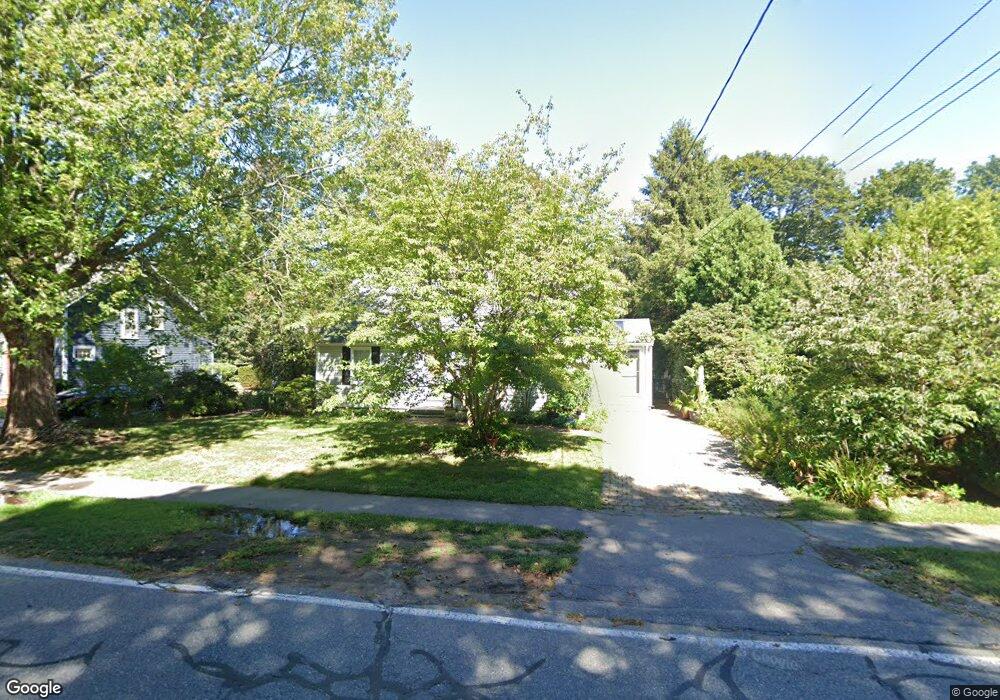
39 Porter St Wenham, MA 01984
Estimated Value: $865,035 - $978,000
2
Beds
2
Baths
2,122
Sq Ft
$431/Sq Ft
Est. Value
About This Home
This home is located at 39 Porter St, Wenham, MA 01984 and is currently estimated at $915,009, approximately $431 per square foot. 39 Porter St is a home located in Essex County with nearby schools including Winthrop School, Bessie Buker Elementary School, and Cutler Elementary School.
Ownership History
Date
Name
Owned For
Owner Type
Purchase Details
Closed on
Apr 14, 2020
Sold by
Mulry Patrick M and Mulry Rebecca
Bought by
Mulry Patrick M
Current Estimated Value
Purchase Details
Closed on
Aug 31, 2017
Sold by
Ann E Mulry Shaw Ret and Mulry
Bought by
Mulry Patrick M and Mulry Rebecca
Home Financials for this Owner
Home Financials are based on the most recent Mortgage that was taken out on this home.
Original Mortgage
$150,000
Interest Rate
3.96%
Mortgage Type
New Conventional
Create a Home Valuation Report for This Property
The Home Valuation Report is an in-depth analysis detailing your home's value as well as a comparison with similar homes in the area
Home Values in the Area
Average Home Value in this Area
Purchase History
| Date | Buyer | Sale Price | Title Company |
|---|---|---|---|
| Mulry Patrick M | -- | None Available | |
| Mulry Patrick M | $250,000 | -- |
Source: Public Records
Mortgage History
| Date | Status | Borrower | Loan Amount |
|---|---|---|---|
| Previous Owner | Mulry Patrick M | $150,000 |
Source: Public Records
Tax History
| Year | Tax Paid | Tax Assessment Tax Assessment Total Assessment is a certain percentage of the fair market value that is determined by local assessors to be the total taxable value of land and additions on the property. | Land | Improvement |
|---|---|---|---|---|
| 2025 | $11,475 | $738,400 | $443,400 | $295,000 |
| 2024 | $11,280 | $720,300 | $443,400 | $276,900 |
| 2023 | $11,644 | $671,100 | $468,200 | $202,900 |
| 2022 | $11,566 | $590,700 | $394,100 | $196,600 |
| 2021 | $11,033 | $560,600 | $364,000 | $196,600 |
| 2020 | $10,137 | $535,200 | $364,200 | $171,000 |
| 2019 | $9,644 | $535,200 | $364,200 | $171,000 |
| 2018 | $9,224 | $490,900 | $352,400 | $138,500 |
| 2017 | $9,022 | $492,200 | $352,400 | $139,800 |
| 2016 | $8,358 | $492,200 | $352,400 | $139,800 |
| 2015 | $7,998 | $492,200 | $352,400 | $139,800 |
Source: Public Records
Map
Nearby Homes
Your Personal Tour Guide
Ask me questions while you tour the home.