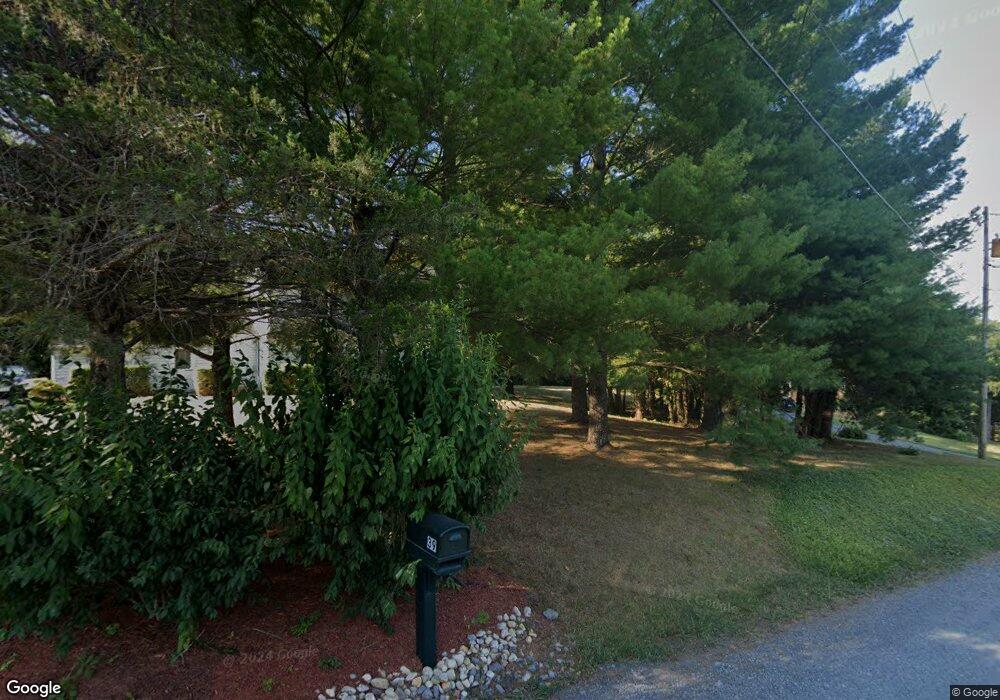
39 Redmon Ln Front Royal, VA 22630
Estimated Value: $445,000 - $480,000
3
Beds
3
Baths
2,016
Sq Ft
$229/Sq Ft
Est. Value
About This Home
This home is located at 39 Redmon Ln, Front Royal, VA 22630 and is currently estimated at $462,278, approximately $229 per square foot. 39 Redmon Ln is a home located in Warren County with nearby schools including Ressie Jeffries Elementary School and Warren County High School.
Ownership History
Date
Name
Owned For
Owner Type
Purchase Details
Closed on
Jul 19, 2013
Sold by
Talbot Joseph P
Bought by
Talbot Joseph P
Current Estimated Value
Home Financials for this Owner
Home Financials are based on the most recent Mortgage that was taken out on this home.
Original Mortgage
$111,709
Outstanding Balance
$78,061
Interest Rate
3.25%
Mortgage Type
Adjustable Rate Mortgage/ARM
Estimated Equity
$384,217
Purchase Details
Closed on
Jan 31, 2005
Sold by
Kuhn Richard A and Kuhn Maureen H
Bought by
Talbot Joseph P
Home Financials for this Owner
Home Financials are based on the most recent Mortgage that was taken out on this home.
Original Mortgage
$85,000
Interest Rate
5.83%
Mortgage Type
New Conventional
Create a Home Valuation Report for This Property
The Home Valuation Report is an in-depth analysis detailing your home's value as well as a comparison with similar homes in the area
Home Values in the Area
Average Home Value in this Area
Purchase History
| Date | Buyer | Sale Price | Title Company |
|---|---|---|---|
| Talbot Joseph P | -- | Wfg National Title Insurance | |
| Talbot Joseph P | $247,000 | -- |
Source: Public Records
Mortgage History
| Date | Status | Borrower | Loan Amount |
|---|---|---|---|
| Open | Talbot Joseph P | $111,709 | |
| Previous Owner | Talbot Joseph P | $85,000 |
Source: Public Records
Tax History
| Year | Tax Paid | Tax Assessment Tax Assessment Total Assessment is a certain percentage of the fair market value that is determined by local assessors to be the total taxable value of land and additions on the property. | Land | Improvement |
|---|---|---|---|---|
| 2025 | $1,963 | $409,900 | $76,700 | $333,200 |
| 2024 | $1,869 | $352,700 | $51,800 | $300,900 |
| 2023 | $1,728 | $352,700 | $51,800 | $300,900 |
| 2022 | $1,575 | $240,400 | $45,000 | $195,400 |
| 2021 | $1,575 | $240,400 | $45,000 | $195,400 |
| 2020 | $1,575 | $240,400 | $45,000 | $195,400 |
| 2019 | $1,575 | $240,400 | $45,000 | $195,400 |
| 2018 | $1,436 | $217,500 | $45,000 | $172,500 |
| 2017 | $1,414 | $217,500 | $45,000 | $172,500 |
| 2016 | $1,349 | $217,500 | $45,000 | $172,500 |
| 2015 | -- | $217,500 | $45,000 | $172,500 |
| 2014 | -- | $191,300 | $41,400 | $149,900 |
Source: Public Records
Map
Nearby Homes
- 302 Hidden View Ln
- 0 Fox Hill Dr
- 0 Old Cave Rd
- 487 Skyline Forest Dr
- 400 Deer Run Cir
- 565 S River Rd
- 10358 Stonewall Jackson Hwy
- 209 Park Ridge Ct
- 364 Stoney Bottom Rd
- 0 Stoney Bottom Rd Unit VAWR2013438
- 0 Fontana Rd Unit VAWR2011676
- 177 Hatcher Dr
- 1057 Harmony Orchard Rd
- 261 Sunset Village Rd
- 204 Russ Johnson Rd
- 0 Russ Johnson Rd
- 1633 Catlett Mountain Rd
- 117 Pointers Way
- 0 Eagle Dr Unit VAWR2013442
- 326 Thunderbird Rd
Your Personal Tour Guide
Ask me questions while you tour the home.