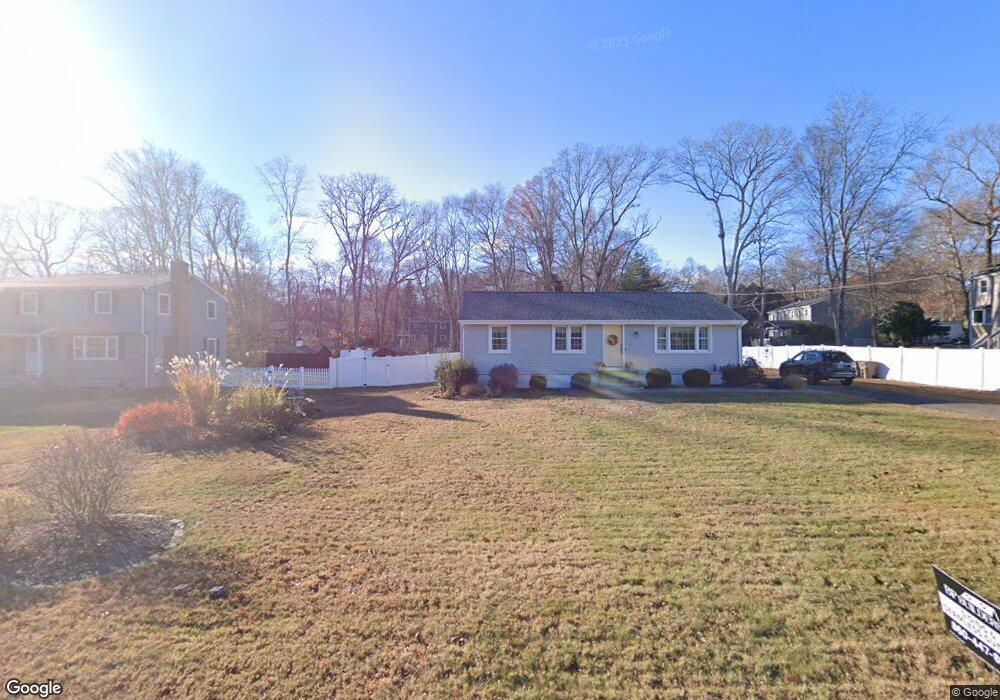
39 Roxbury Ct Niantic, CT 06357
Estimated Value: $374,000 - $450,000
3
Beds
2
Baths
1,104
Sq Ft
$382/Sq Ft
Est. Value
About This Home
This home is located at 39 Roxbury Ct, Niantic, CT 06357 and is currently estimated at $422,200, approximately $382 per square foot. 39 Roxbury Ct is a home located in New London County with nearby schools including East Lyme Middle School, East Lyme High School, and The Light House Voc-Ed Center.
Ownership History
Date
Name
Owned For
Owner Type
Purchase Details
Closed on
Oct 5, 2021
Sold by
Hefflefinger Robert A and Hefflefinger Candace L
Bought by
Hefflefinger T
Current Estimated Value
Purchase Details
Closed on
Apr 4, 2002
Sold by
Est Barry Mildred and Kronholm Kathleen
Bought by
Hefflefinger Robert A and Hefflefinger Candace L
Create a Home Valuation Report for This Property
The Home Valuation Report is an in-depth analysis detailing your home's value as well as a comparison with similar homes in the area
Home Values in the Area
Average Home Value in this Area
Purchase History
| Date | Buyer | Sale Price | Title Company |
|---|---|---|---|
| Hefflefinger T | -- | None Available | |
| Hefflefinger Robert A | $127,000 | -- |
Source: Public Records
Mortgage History
| Date | Status | Borrower | Loan Amount |
|---|---|---|---|
| Previous Owner | Hefflefinger Robert A | $180,000 | |
| Previous Owner | Hefflefinger Robert A | $173,000 | |
| Previous Owner | Hefflefinger Robert A | $125,336 | |
| Previous Owner | Hefflefinger Robert A | $125,781 |
Source: Public Records
Tax History
| Year | Tax Paid | Tax Assessment Tax Assessment Total Assessment is a certain percentage of the fair market value that is determined by local assessors to be the total taxable value of land and additions on the property. | Land | Improvement |
|---|---|---|---|---|
| 2025 | $5,164 | $184,380 | $85,960 | $98,420 |
| 2024 | $4,858 | $184,380 | $85,960 | $98,420 |
| 2023 | $4,587 | $184,380 | $85,960 | $98,420 |
| 2022 | $4,396 | $184,380 | $85,960 | $98,420 |
| 2021 | $4,189 | $146,930 | $81,690 | $65,240 |
| 2020 | $4,139 | $145,950 | $81,690 | $64,260 |
| 2019 | $4,114 | $145,950 | $81,690 | $64,260 |
| 2018 | $3,992 | $145,950 | $81,690 | $64,260 |
| 2017 | $3,818 | $145,950 | $81,690 | $64,260 |
| 2016 | $3,595 | $141,750 | $77,350 | $64,400 |
| 2015 | $3,503 | $141,750 | $77,350 | $64,400 |
| 2014 | $3,406 | $141,750 | $77,350 | $64,400 |
Source: Public Records
Map
Nearby Homes
- 43 Roxbury Ct
- 55 Corey Ln
- 97 W Main St Unit 24
- 97 W Main St Unit 36
- 82 Roxbury Rd
- 80 Roxbury Rd
- 37 Stoneywood Dr
- 19 Sapia Dr
- 18 Compass Ct
- 46 Village Crossing Unit 46
- 47 Village Crossing Unit 47
- 31 Regatta Dr
- 43 Village Crossing Unit 43
- 68-70 Black Point Rd
- 15 Freedom Way Unit 105
- 15 Freedom Way Unit 92
- 127 Black Point Rd Unit 7
- 468 Main St Unit 318
- 468 Main St Unit 111
- 9 Columbus Ave
Your Personal Tour Guide
Ask me questions while you tour the home.