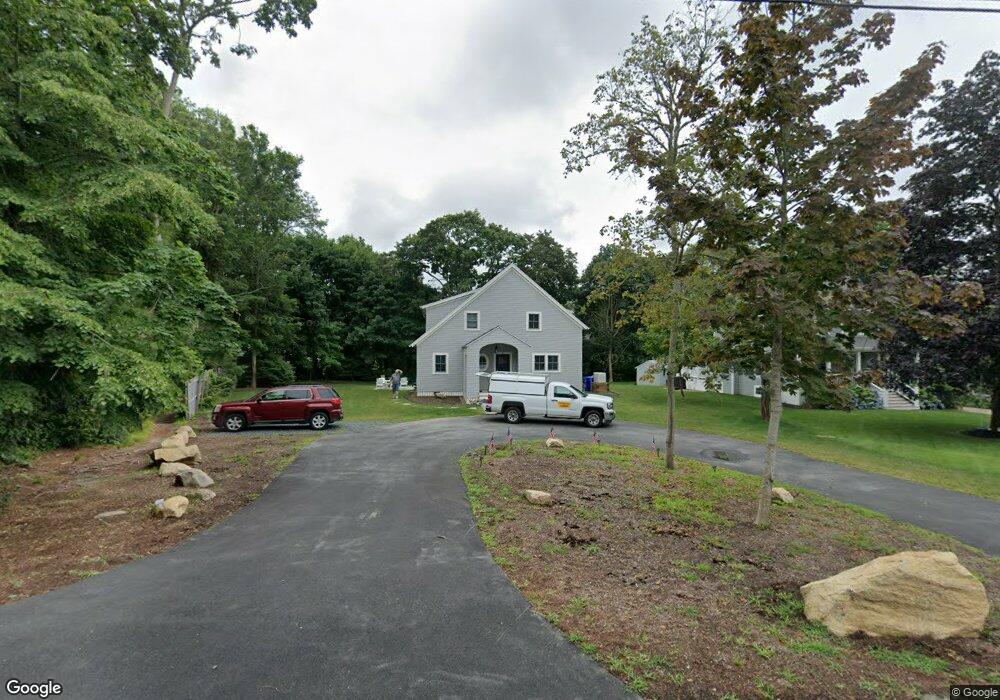
39 Salt Marsh Ln Pocasset, MA 02559
Pocasset NeighborhoodEstimated Value: $894,000 - $1,325,177
3
Beds
3
Baths
2,516
Sq Ft
$434/Sq Ft
Est. Value
About This Home
This home is located at 39 Salt Marsh Ln, Pocasset, MA 02559 and is currently estimated at $1,091,294, approximately $433 per square foot. 39 Salt Marsh Ln is a home located in Barnstable County with nearby schools including Bourne High School and Cadence Academy Preschool - Bourne.
Ownership History
Date
Name
Owned For
Owner Type
Purchase Details
Closed on
Jul 19, 2021
Sold by
Cerbo Ft and Cerbo
Bought by
Cjc & Sbt Ft and Towle
Current Estimated Value
Purchase Details
Closed on
Jul 18, 2021
Sold by
Amc Rt and Cerbo
Bought by
Cerbo Ft and Cerbo
Purchase Details
Closed on
May 31, 2017
Sold by
Amc Rt and Cerbo
Bought by
Amc Rt 2 and Cerbo
Create a Home Valuation Report for This Property
The Home Valuation Report is an in-depth analysis detailing your home's value as well as a comparison with similar homes in the area
Home Values in the Area
Average Home Value in this Area
Purchase History
| Date | Buyer | Sale Price | Title Company |
|---|---|---|---|
| Cjc & Sbt Ft | -- | None Available | |
| Cjc & Sbt Ft | -- | None Available | |
| Amc Rt | -- | None Available | |
| Amc Rt | -- | None Available | |
| Cerbo Ft | -- | None Available | |
| Cerbo Ft | -- | None Available | |
| Amc Rt 2 | -- | -- | |
| Amc Rt 2 | -- | -- |
Source: Public Records
Tax History Compared to Growth
Tax History
| Year | Tax Paid | Tax Assessment Tax Assessment Total Assessment is a certain percentage of the fair market value that is determined by local assessors to be the total taxable value of land and additions on the property. | Land | Improvement |
|---|---|---|---|---|
| 2025 | $7,781 | $996,300 | $423,600 | $572,700 |
| 2024 | $7,572 | $944,100 | $403,400 | $540,700 |
| 2023 | $4,724 | $536,200 | $357,100 | $179,100 |
| 2022 | $4,264 | $422,600 | $280,100 | $142,500 |
| 2021 | $4,145 | $384,900 | $254,900 | $130,000 |
| 2020 | $4,107 | $382,400 | $252,500 | $129,900 |
| 2019 | $3,944 | $375,300 | $252,500 | $122,800 |
| 2018 | $3,885 | $368,600 | $246,600 | $122,000 |
| 2017 | $3,661 | $355,400 | $244,300 | $111,100 |
| 2016 | $3,295 | $324,300 | $232,100 | $92,200 |
| 2015 | $3,081 | $306,000 | $213,800 | $92,200 |
Source: Public Records
Map
Nearby Homes
- 171 Bellavista Dr
- 34 Kenwood Rd
- 45 Kenwood Rd
- 70 Wings Neck Rd
- 24 Richmond Rd
- 89 Harbor Dr
- 14 Navajo Rd
- 254 Barlows Landing Rd
- 22 Nairn Rd
- 940 County Rd
- 709 County Rd
- 48 Red Brook Harbor Rd
- 3 Red Brook Pond Dr
- 174 Barlows Landing Rd
- 39 Bennets Neck Dr
- 1094 County Rd
- 15 1st St
- 7 4th Ave
- 940 County Rd
- 75 Winsor Rd
- 41 Salt Marsh Ln
- 35 Salt Marsh Ln
- 109 Bellavista Dr
- 105 Bellavista Dr
- 36 Salt Marsh Ln
- 111 Bellavista Dr
- 47 Salt Marsh Ln
- 40 Salt Marsh Ln
- 44 Salt Marsh Ln
- 115 Bellavista Dr
- 121 Bellavista Dr
- 46 Salt Marsh Ln
- 99 Bellavista Dr
- 28 Salt Marsh Ln
- 100 Bellavista Dr
- 100 Bellavista Dr
- 26 Virginia Rd
- 50 Salt Marsh Ln
- 55 Salt Marsh Ln
- 127 Bellavista Dr