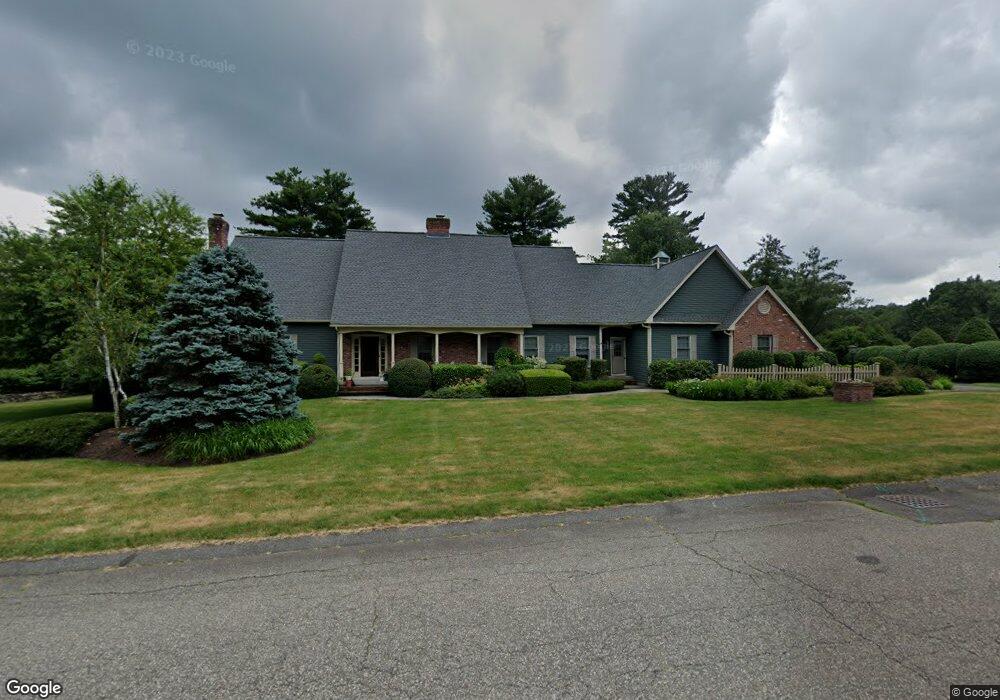
39 San Souci Dr South Hadley, MA 01075
Estimated Value: $813,000 - $1,106,000
4
Beds
5
Baths
4,000
Sq Ft
$235/Sq Ft
Est. Value
About This Home
This home is located at 39 San Souci Dr, South Hadley, MA 01075 and is currently estimated at $939,883, approximately $234 per square foot. 39 San Souci Dr is a home located in Hampshire County with nearby schools including Plains Elementary School, Mosier Elementary School, and Michael E. Smith Middle School.
Ownership History
Date
Name
Owned For
Owner Type
Purchase Details
Closed on
Nov 16, 2011
Sold by
Murphy Marilyn A
Bought by
Rhodes Anthony L B and Dietzen Diane L
Current Estimated Value
Home Financials for this Owner
Home Financials are based on the most recent Mortgage that was taken out on this home.
Original Mortgage
$558,000
Outstanding Balance
$378,660
Interest Rate
3.92%
Mortgage Type
Purchase Money Mortgage
Estimated Equity
$561,223
Purchase Details
Closed on
Apr 24, 1995
Sold by
Snowcres Dev Group
Bought by
Murphy Edward M and Murphy Marilyn A
Home Financials for this Owner
Home Financials are based on the most recent Mortgage that was taken out on this home.
Original Mortgage
$200,000
Interest Rate
8.55%
Mortgage Type
Purchase Money Mortgage
Create a Home Valuation Report for This Property
The Home Valuation Report is an in-depth analysis detailing your home's value as well as a comparison with similar homes in the area
Home Values in the Area
Average Home Value in this Area
Purchase History
| Date | Buyer | Sale Price | Title Company |
|---|---|---|---|
| Rhodes Anthony L B | $620,000 | -- | |
| Murphy Edward M | $400,000 | -- |
Source: Public Records
Mortgage History
| Date | Status | Borrower | Loan Amount |
|---|---|---|---|
| Open | Rhodes Anthony L B | $558,000 | |
| Previous Owner | Murphy Edward M | $100,000 | |
| Previous Owner | Murphy Edward M | $200,000 | |
| Closed | Murphy Edward M | $50,000 |
Source: Public Records
Tax History Compared to Growth
Tax History
| Year | Tax Paid | Tax Assessment Tax Assessment Total Assessment is a certain percentage of the fair market value that is determined by local assessors to be the total taxable value of land and additions on the property. | Land | Improvement |
|---|---|---|---|---|
| 2025 | $15,680 | $984,300 | $144,000 | $840,300 |
| 2024 | $15,866 | $952,900 | $134,100 | $818,800 |
| 2023 | $15,688 | $893,900 | $121,800 | $772,100 |
| 2022 | $14,640 | $792,200 | $121,800 | $670,400 |
| 2021 | $14,496 | $744,900 | $114,000 | $630,900 |
| 2020 | $13,952 | $699,700 | $114,000 | $585,700 |
| 2019 | $13,946 | $692,100 | $108,800 | $583,300 |
| 2018 | $13,427 | $673,700 | $105,600 | $568,100 |
| 2017 | $12,756 | $634,000 | $105,600 | $528,400 |
| 2016 | $12,136 | $611,400 | $96,400 | $515,000 |
| 2015 | $11,521 | $594,500 | $93,600 | $500,900 |
Source: Public Records
Map
Nearby Homes
- Lot 1 Edgewater Ln
- 4 Sunrise Cir
- 88 Alvord St
- 75 Pine St
- 85 Fairview St
- 84 Judd Ave
- 120 Camden St
- 457 Northampton St
- 119 Central Park Dr
- 77 Central Park Dr
- 70 Lathrop St
- 179 Central Park Dr
- 41 W Summit St Unit 55
- 41 W Summit St Unit 38
- 10 Radcliffe St
- 108 College St
- 17 Cleveland St
- 19 Hildreth Ave
- 126 Stonybrook Way
- 31 Wellesley Rd
- 41 San Souci Dr
- 38 San Souci Dr
- 36 San Souci Dr
- 37 San Souci Dr
- 40 San Souci Dr
- 58 San Souci Dr
- 43 San Souci Dr
- 34 San Souci Dr
- 42 San Souci Dr
- 35 San Souci Dr
- 67 San Souci Dr
- 63 San Souci Dr
- 62 San Souci Dr
- 61 San Souci Dr
- 44 San Souci Dr
- 32 San Souci Dr
- 69 San Souci Dr
- 33 San Souci Dr
- 45 San Souci Dr
- 52 San Souci Dr