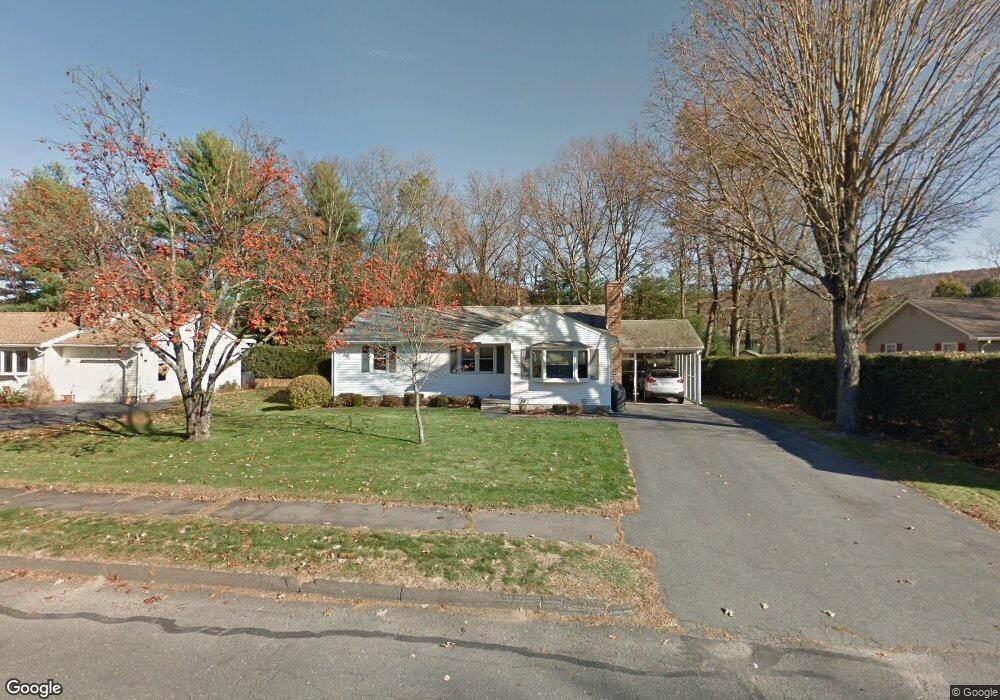
39 Sandra Rd Easthampton, MA 01027
Estimated Value: $388,221 - $454,000
3
Beds
2
Baths
1,170
Sq Ft
$350/Sq Ft
Est. Value
About This Home
This home is located at 39 Sandra Rd, Easthampton, MA 01027 and is currently estimated at $409,805, approximately $350 per square foot. 39 Sandra Rd is a home located in Hampshire County with nearby schools including Easthampton High School, Calvary Baptist Christian School, and Tri-County Schools.
Ownership History
Date
Name
Owned For
Owner Type
Purchase Details
Closed on
Apr 19, 2021
Sold by
Nadin Karen and Wodecki Colleen
Bought by
R & Kathleen Diemand Ft
Current Estimated Value
Purchase Details
Closed on
Oct 24, 1973
Bought by
Diemand Richard A
Create a Home Valuation Report for This Property
The Home Valuation Report is an in-depth analysis detailing your home's value as well as a comparison with similar homes in the area
Home Values in the Area
Average Home Value in this Area
Purchase History
| Date | Buyer | Sale Price | Title Company |
|---|---|---|---|
| R & Kathleen Diemand Ft | -- | None Available | |
| Nadin Karen | -- | None Available | |
| Diemand Richard A | -- | -- |
Source: Public Records
Mortgage History
| Date | Status | Borrower | Loan Amount |
|---|---|---|---|
| Previous Owner | Diemand Richard A | $10,000 | |
| Previous Owner | Diemand Richard A | $48,000 | |
| Previous Owner | Diemand Richard A | $10,000 |
Source: Public Records
Tax History
| Year | Tax Paid | Tax Assessment Tax Assessment Total Assessment is a certain percentage of the fair market value that is determined by local assessors to be the total taxable value of land and additions on the property. | Land | Improvement |
|---|---|---|---|---|
| 2025 | $4,722 | $345,400 | $118,700 | $226,700 |
| 2024 | $4,558 | $336,100 | $115,200 | $220,900 |
| 2023 | $3,737 | $255,100 | $90,600 | $164,500 |
| 2022 | $4,217 | $255,100 | $90,600 | $164,500 |
| 2021 | $4,848 | $263,400 | $90,600 | $172,800 |
| 2020 | $4,531 | $255,100 | $90,600 | $164,500 |
| 2019 | $3,792 | $245,300 | $90,600 | $154,700 |
| 2018 | $3,606 | $225,400 | $85,600 | $139,800 |
| 2017 | $3,521 | $217,200 | $82,300 | $134,900 |
| 2016 | $3,386 | $217,200 | $82,300 | $134,900 |
| 2015 | $3,291 | $217,200 | $82,300 | $134,900 |
Source: Public Records
Map
Nearby Homes
Your Personal Tour Guide
Ask me questions while you tour the home.