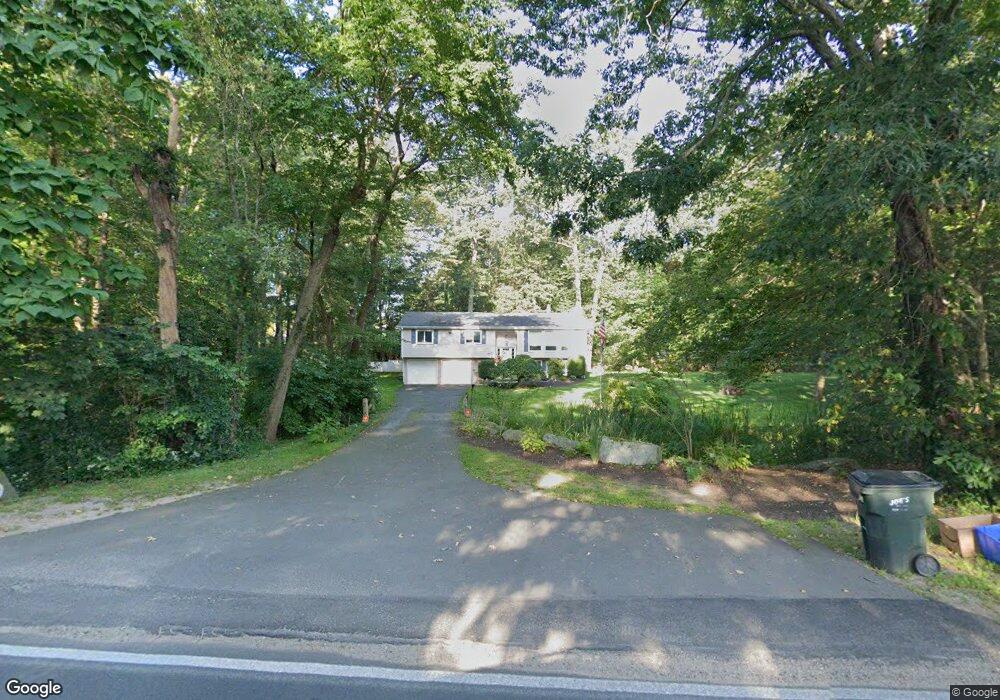
39 Scott Rd Prospect, CT 06712
Estimated Value: $320,000 - $435,756
3
Beds
2
Baths
1,444
Sq Ft
$265/Sq Ft
Est. Value
About This Home
This home is located at 39 Scott Rd, Prospect, CT 06712 and is currently estimated at $382,439, approximately $264 per square foot. 39 Scott Rd is a home located in New Haven County with nearby schools including Prospect Elementary School, Long River Middle School, and Woodland Regional High School.
Ownership History
Date
Name
Owned For
Owner Type
Purchase Details
Closed on
Oct 31, 1997
Sold by
Caravette Joseph W and Caravette Lisa
Bought by
Dillon Harry E and Dillon Angela M
Current Estimated Value
Purchase Details
Closed on
Apr 30, 1993
Sold by
First Federal Bk
Bought by
Caravetta Joseph W and Caravetta Lisa
Create a Home Valuation Report for This Property
The Home Valuation Report is an in-depth analysis detailing your home's value as well as a comparison with similar homes in the area
Home Values in the Area
Average Home Value in this Area
Purchase History
| Date | Buyer | Sale Price | Title Company |
|---|---|---|---|
| Dillon Harry E | $153,000 | -- | |
| Caravetta Joseph W | $134,000 | -- |
Source: Public Records
Mortgage History
| Date | Status | Borrower | Loan Amount |
|---|---|---|---|
| Open | Caravetta Joseph W | $174,000 | |
| Closed | Caravetta Joseph W | $55,000 |
Source: Public Records
Tax History
| Year | Tax Paid | Tax Assessment Tax Assessment Total Assessment is a certain percentage of the fair market value that is determined by local assessors to be the total taxable value of land and additions on the property. | Land | Improvement |
|---|---|---|---|---|
| 2025 | $6,435 | $251,650 | $81,130 | $170,520 |
| 2024 | $5,428 | $168,880 | $81,170 | $87,710 |
| 2023 | $5,391 | $168,880 | $81,170 | $87,710 |
| 2022 | $5,396 | $168,880 | $81,170 | $87,710 |
| 2021 | $5,455 | $168,880 | $81,170 | $87,710 |
| 2020 | $5,389 | $170,550 | $81,160 | $89,390 |
| 2019 | $5,279 | $170,550 | $81,160 | $89,390 |
| 2018 | $5,287 | $170,550 | $81,160 | $89,390 |
| 2017 | $5,330 | $170,550 | $81,160 | $89,390 |
| 2016 | $5,101 | $170,550 | $81,160 | $89,390 |
| 2015 | $5,088 | $174,070 | $81,160 | $92,910 |
| 2014 | $5,045 | $174,070 | $81,160 | $92,910 |
Source: Public Records
Map
Nearby Homes
Your Personal Tour Guide
Ask me questions while you tour the home.