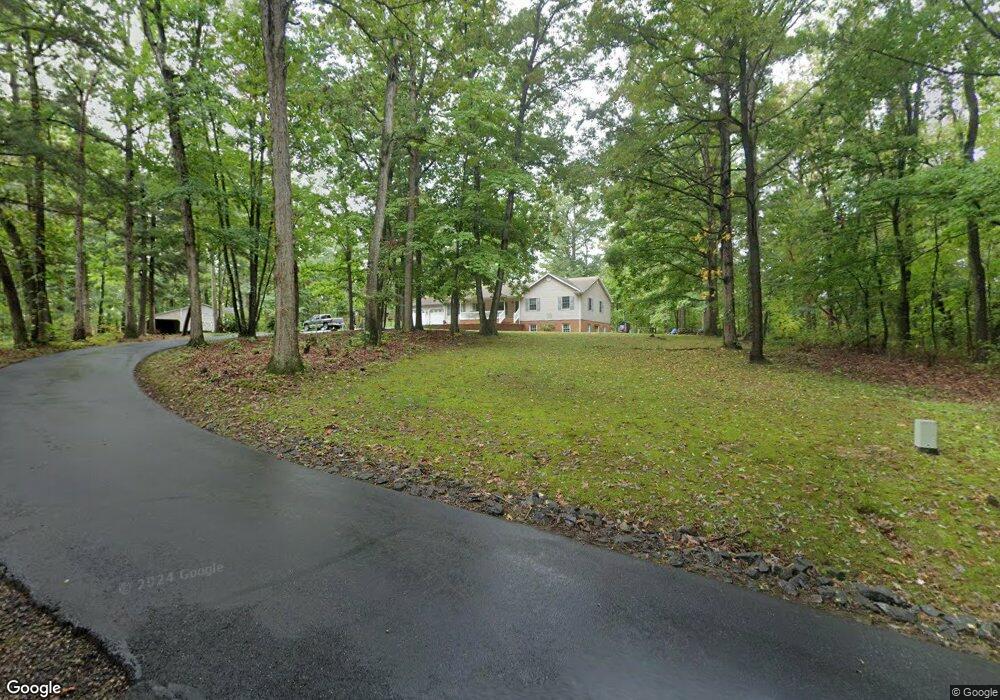
39 Shady Pond Ln Stuarts Draft, VA 24477
Estimated Value: $509,000 - $555,000
3
Beds
4
Baths
3,322
Sq Ft
$158/Sq Ft
Est. Value
About This Home
This home is located at 39 Shady Pond Ln, Stuarts Draft, VA 24477 and is currently estimated at $525,585, approximately $158 per square foot. 39 Shady Pond Ln is a home located in Augusta County with nearby schools including Guy K. Stump Elementary School, Stuarts Draft Middle School, and Stuarts Draft High School.
Ownership History
Date
Name
Owned For
Owner Type
Purchase Details
Closed on
Nov 14, 2013
Sold by
Alexander C Tad and Alexander Morgan C
Bought by
Nystrom James P and Nystrom Leidi M
Current Estimated Value
Home Financials for this Owner
Home Financials are based on the most recent Mortgage that was taken out on this home.
Original Mortgage
$280,612
Outstanding Balance
$208,517
Interest Rate
4.14%
Mortgage Type
New Conventional
Estimated Equity
$317,068
Purchase Details
Closed on
Oct 16, 2006
Sold by
Lashley Layne L and Lashley Ericka P
Bought by
Corbin Brandon N and Corbin Heather E
Home Financials for this Owner
Home Financials are based on the most recent Mortgage that was taken out on this home.
Original Mortgage
$246,000
Interest Rate
6.48%
Mortgage Type
New Conventional
Create a Home Valuation Report for This Property
The Home Valuation Report is an in-depth analysis detailing your home's value as well as a comparison with similar homes in the area
Home Values in the Area
Average Home Value in this Area
Purchase History
| Date | Buyer | Sale Price | Title Company |
|---|---|---|---|
| Nystrom James P | $275,000 | Attorney | |
| Corbin Brandon N | -- | -- |
Source: Public Records
Mortgage History
| Date | Status | Borrower | Loan Amount |
|---|---|---|---|
| Open | Nystrom James P | $280,612 | |
| Previous Owner | Corbin Brandon N | $246,000 |
Source: Public Records
Tax History Compared to Growth
Tax History
| Year | Tax Paid | Tax Assessment Tax Assessment Total Assessment is a certain percentage of the fair market value that is determined by local assessors to be the total taxable value of land and additions on the property. | Land | Improvement |
|---|---|---|---|---|
| 2025 | $2,414 | $464,300 | $77,900 | $386,400 |
| 2024 | $2,414 | $464,300 | $77,900 | $386,400 |
| 2023 | $2,018 | $320,300 | $90,200 | $230,100 |
| 2022 | $2,018 | $320,300 | $90,200 | $230,100 |
| 2021 | $2,018 | $320,300 | $90,200 | $230,100 |
| 2020 | $2,018 | $320,300 | $90,200 | $230,100 |
| 2019 | $2,018 | $320,300 | $90,200 | $230,100 |
| 2018 | $1,892 | $300,344 | $90,200 | $210,144 |
| 2017 | $1,742 | $300,344 | $90,200 | $210,144 |
| 2016 | $1,742 | $300,344 | $90,200 | $210,144 |
| 2015 | $1,406 | $300,344 | $90,200 | $210,144 |
| 2014 | $1,406 | $300,344 | $90,200 | $210,144 |
| 2013 | $1,406 | $292,900 | $81,400 | $211,500 |
Source: Public Records
Map
Nearby Homes
- 728 Cold Springs Rd
- TBD Howardsville Turnpike
- TBD Churchmans Mill Rd
- TBD Gerties Ln
- 0 Kiley Ln Unit 569156
- TBD Cold Springs Rd
- 69 Allentown Ln
- 347 Horseshoe Cir
- 112 Arrowhead Ln
- 111 Rutherford Ln
- 39 Forest Springs Dr
- 253 Forest Springs Dr
- 0 Johnson Dr
- 343 Forest Springs Dr
- 294 Forest Springs Dr
- 251 Cooper Dr
- 377 Forest Springs Dr
- 378 Forest Springs Dr
- 87 Falling Rock Dr
- 150 Falling Rock Dr
- 38 Shady Pond Ln
- 46 Mullins Ln
- 26 Mullins Ln
- 28 Shady Pond Ln
- 18 Mullins Ln
- 602 Cold Springs Rd
- 532 Cold Springs Rd
- 534 Cold Springs Rd
- 55 Mullins Ln
- 9 Mullins Ln
- 530 Cold Springs Rd
- 84 Mullins Ln
- 84 Mullins Ln
- 84 Mullins Ln
- 41 Horseshoe Cir
- 92 Mullins Ln
- 131 Horseshoe Cir
- 649 Cold Springs Rd
- 686 Cold Springs Rd
- 116 Mullins Ln